
Figure 2.
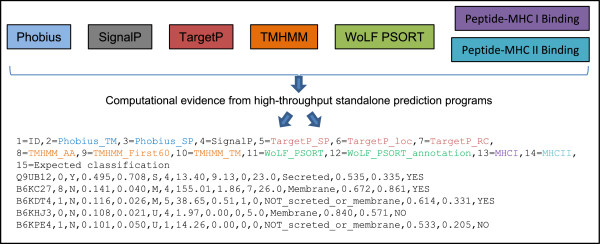
An extract of evidence profiles. Specific values from high-throughput standalone prediction programs are extracted and compiled to generate evidence profiles. Each row contains the collection of evidence for one protein (i.e. an evidence profile). Each column contains the score for a protein characteristic predicted by a specific program (i.e. an input variable or predictor). See the ‘Contents of evidence profiles’ subsection for a description of the columns. We apologise if the reintroduction of Figure 2 creates additional work for you, but hopefully you can appreciate the problem raised above, and ultimately the readers will benefit.