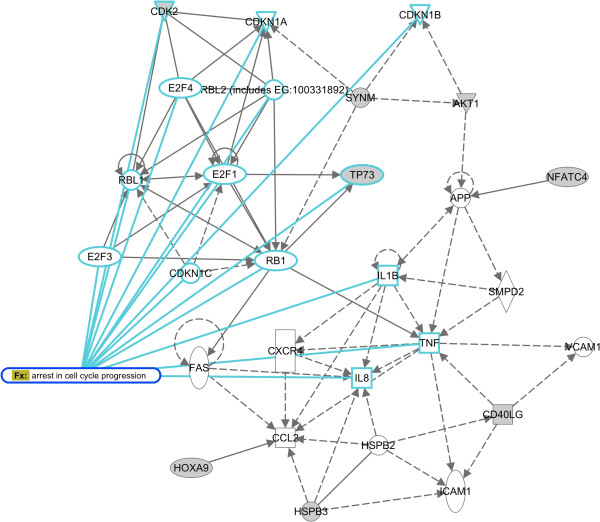
Figure 7.
Pathway analysis of deregulated genes upon miR-196a overexpression in keratinocytes. Shown is the most significant interaction network based on deregulated genes in miR-196a overexpressing keratinocytes, calculated by IPA. The network is termed “DNA replication, recombination and repair, cell cycle”. In grey, deregulated genes from gene expression profiling.

