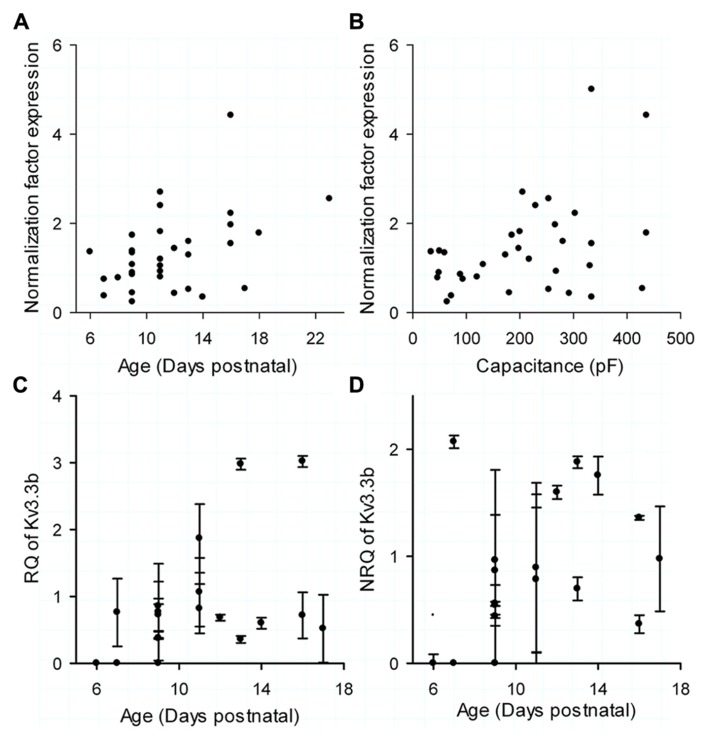
FIGURE 4.
Real time PCR data. (A) Normalization factor (NF) of each cell, calculated as the average expression of the two housekeeping genes compared to postnatal age. (B) NF of each cell compared to total cell capacitance (measured by 500 Hz sinus wave). (C) Relative quantity (RQ) of Kv3.3b versus postnatal age. (D) Normalized relative quantity (NRQ) of Kv3.3b of each cell, calculated by dividing RQ (C) by NF (A,B) versus postnatal age. The error bars in (C,D) were determined through calculating the error propagation of the normalized or non-normalized relative quantity of the Kv3.3b real time PCR assay.

