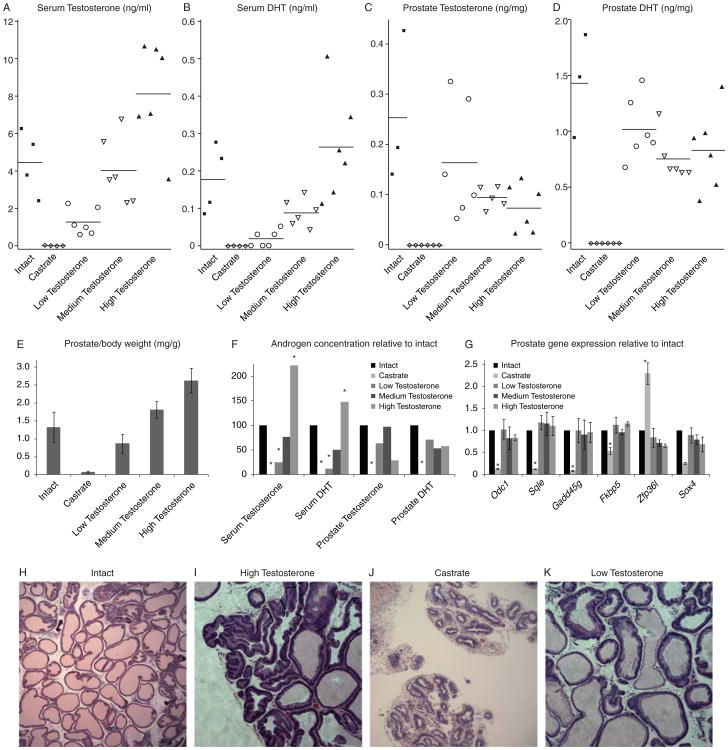
Figure 1. Serum and prostate levels of androgens.
The levels of serum T (A), serum DHT (B), prostate T (C), and prostate DHT (D) are shown for each rat. (E) Average wet prostate weight from each treatment group. (F) The average concentration of T and DHT in each treatment group compared to intact rats. (G) Relative gene expression for a panel of androgen-responsive genes in the prostates of each treatment group compared to intact rats. Though serum androgen levels are vastly different, prostate androgen levels are very similar in all T-treatment groups, leading to equivalent androgen-dependent gene expression. (H-K) Representative H&E (20× magnification) staining from intact (H), high T (I), castrate (J) and low T (K) rat prostates. Statistically significant differences from intact group (ANOVA, p < 0.05) are indicated by *.

