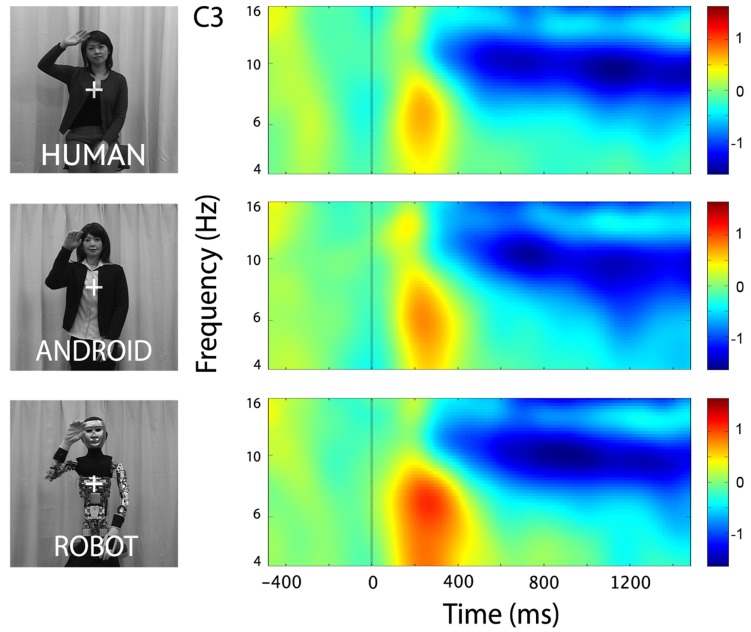
FIGURE 2.
Time-frequency plots for the three conditions (Human, Android, Robot) at channel C3 (left hemisphere). Plots for the right hemisphere (C4) were very similar and are not shown. The frequency axis is log scaled. The zero point on the time axis indicates the onset of the action movies. Shortly after the onset of the action videos, we observed an increase in the theta frequency band (see also Figure 4), followed by an attenuation in the alpha frequency band (8–13 Hz) that started around 350 ms, and grew stronger around 600 ms.

