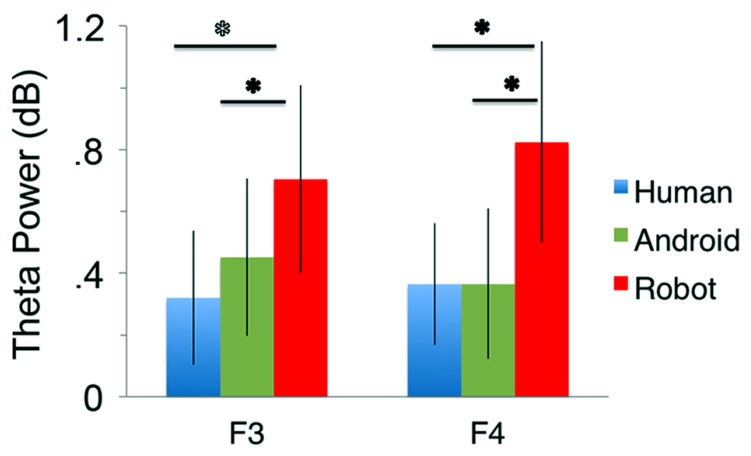
FIGURE 5.
Power in the theta frequency range (4–8 Hz, in dB) for the three conditions (Human, Android, Robot) plotted at channels F3 and F4. Error bars indicate the standard error of the mean. All conditions led to significant increase in theta power (all p’s í 0.05, see Results). The Robot condition led to significantly increased theta power in comparison to the Android and Human conditions (*p’s í 0.05, see Results).

