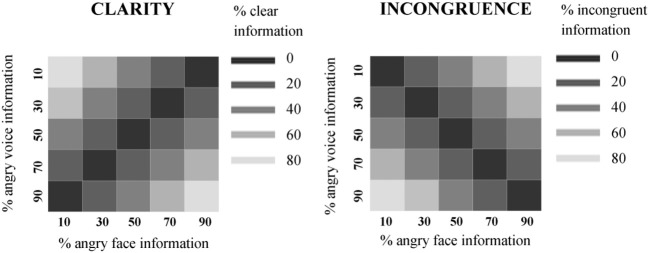
Figure 2.

Clarity and incongruence values assigned to face-voice stimuli. Left: Clarity values. Each square in the grid represents one audiovisual stimulus. The horizontal value indicates the percentage of angry face information contained in the stimulus, and the vertical value represents the percentage of angry voice information contained in the stimulus. The color represents the clarity value of the stimulus (darkest = lowest clarity value = unclear combined information in the stimulus; lightest = highest clarity value = clear combined information in the stimulus). Right: Incongruence values. Each square in the grid represents one audiovisual stimulus. The horizontal value indicates the percentage of angry face information contained in the stimulus, and the vertical value represents the percentage of angry voice information contained in the stimulus. The color represents the incongruence value of the stimulus (darkest = lowest incongruence value = no difference in affect level of face and voice; lightest = highest = highest incongruence value = maximal difference in affect level of face and voice).
