Figure 4.

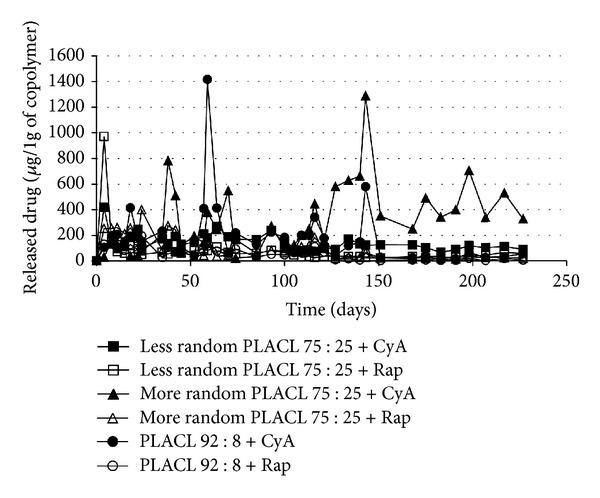
The release profile of cyclosporine A and rapamycine from different kinds of PLACL matrices during 227 days (μg/1 g of copolymer). Each point represents the mean of three points.

The release profile of cyclosporine A and rapamycine from different kinds of PLACL matrices during 227 days (μg/1 g of copolymer). Each point represents the mean of three points.