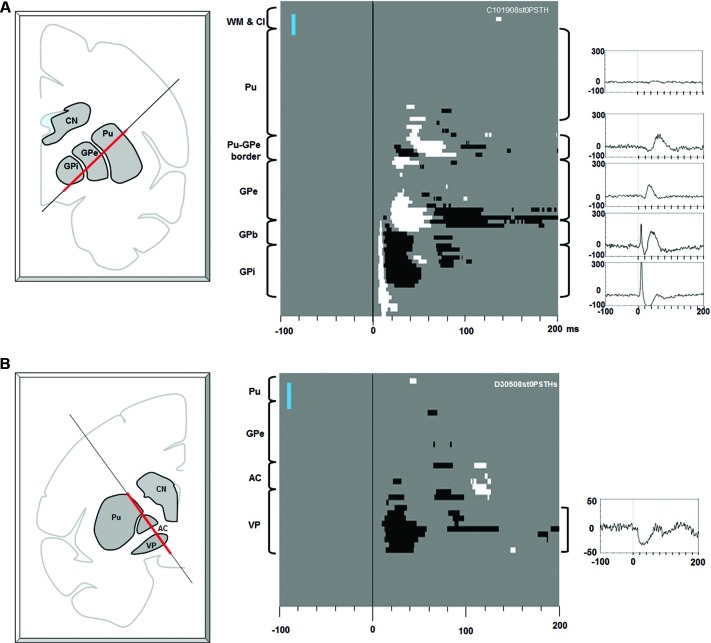
Figure 2.
Effects of electrical stimulation along electrode tracks through the putamen-pallidal region. (A) Stimulations along the putamen-globus pallidus external segment (GPe)-GPi track. Left: The location of the stimulating electrode track. The red line indicates where the stimulation data were collected. Center: Significant effects (white: excitation, black: inhibition) shown in depth (ordinate) and time (abscissa). At each depth of stimulation, the LHb neuron activity in a pre-stimulation period (duration: 200 ms) was analyzed to generate a 95% confidence threshold. This threshold was used to determine a significant post-stimulation deviation of the LHb activity. The anatomical landmarks are indicated on the left side of the figure (WM: white matter; Cl: claustrum). The vertical blue bar indicates 1 mm. Right: Average LHb activity (baseline subtracted PSTH) in the structure corresponding to the bracket next to each peri-stimulus time histogram (PSTH). (B) Stimulations along the putamen-VP track. The same convention as in (A).

