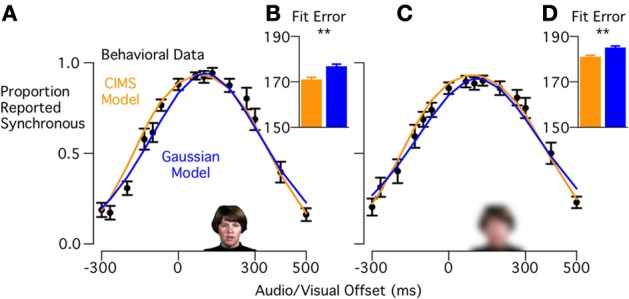
Figure 3.

Model fits to behavioral data for experiment 1 (high visual intelligibility words). (A) Black circles show the behavioral data from 16 subjects performing a synchrony judgment task (mean ± standard error) for each stimulus asynchrony with visual reliable, high visual intelligibility stimuli. Curves show the model predictions for the CIMS model (orange) and Gaussian model (blue). (B) Fit error measured with Bayesian Information Criterion (BIC) for the CIMS and Gaussian models; lower values indicate a better fit for the CIMS model (**p = 0.006). Error bars show within-subject standard error (Loftus and Masson, 1994). (C) Mean proportion of synchrony responses and model predictions for visual blurred, high visual intelligibility stimuli. (D) Fit error for the CIMS and Gaussian models, showing better fit for the CIMS model (**p = 0.007).
