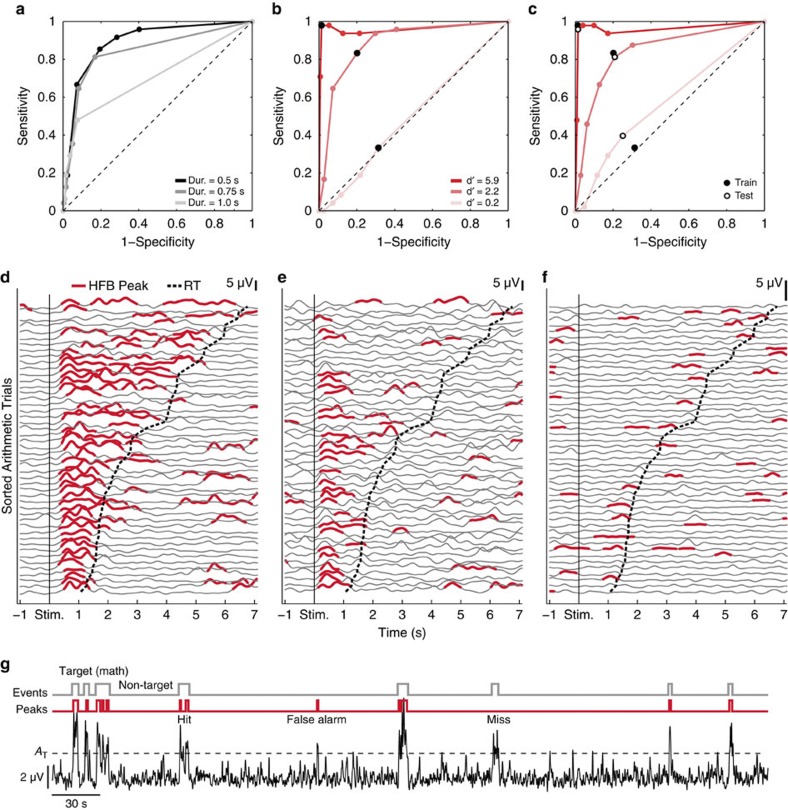
Figure 3. Establishing optimal parameters for detecting HFB peak events.
ROC curve in a is from electrode P1–2 and the three lines are for three different duration parameters (0.5, 0.75 and 1.0 s). Each dot on the lines represents a given amplitude threshold. For the optimal duration parameter 0.5 s (black line), the best amplitude threshold is the one with maximal specificity and sensitivity values, that is, closest to the top left. The ROC curve in b is for three adjacent electrodes in P1 with three different d′-values. Electrode P1–1 (marked in Fig. 1e) had the highest d′-value of 5.9. The electrode immediately anterior to this, had a lesser d′-value of 2.2 (same ROCs as in a). The electrode immediately posterior to P1–1 had a d′-value of 0.2. The position of these electrodes are shown in Fig. 1e, P1. The ROC curve of the electrode P1–1 is closest to the top left corner with highest sensitivity and specificity values. In contrast, the ROC curves of the electrode with minimum d′-value lies almost on the diagonal line. The ROC in c shows the values from training and testing sessions in the same three adjacent electrodes as in b. Parameters from the training and testing sessions gave very similar results (hollow and filled markings). Data in d–f are for the same three electrodes as in b and c, showing the sorted arithmetic trials in electrodes with d′-values of 5.9 (d), 2.2 (e) and 0.2 (f). All arithmetic trials were sorted based on their durations and aligned with respect to the stimulus onset (black vertical line.) The participant’s button-press was marked by the dashed curved line followed by the next trial. Continuous HFB power fluctuation along with the HFB peaks and continuous sequence of arithmetic and non-arithmetic trials in a 5-min recording are shown in g. The HFB peaks (red) marked the significant increase in the HFB power that co-occurred during arithmetic trials (hit) and non-arithmetic trials (false alarm).

