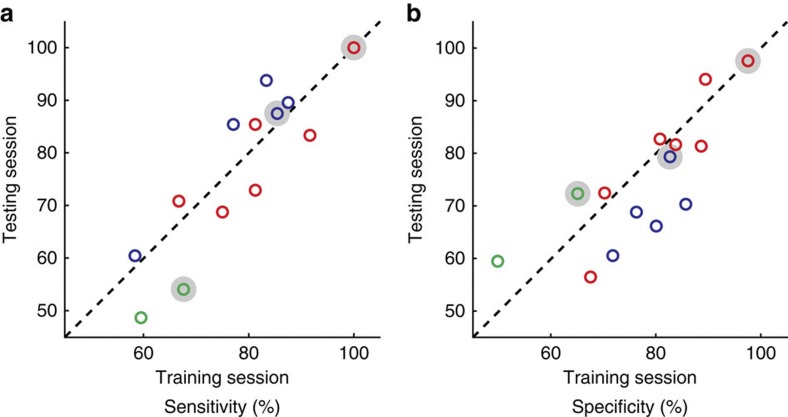
Figure 4. Sensitivity and specificity values in training and testing sessions.
Parameters from the training session produced similar results on the testing session; the sensitivity (a) and specificity (b) values obtained from applying parameters from the first session (training session) and from the second session (testing session) were similar (close to diagonal line where two values are identical). Each point indicates an electrode from participants P1 (red), P2 (blue) and P3 (green).

