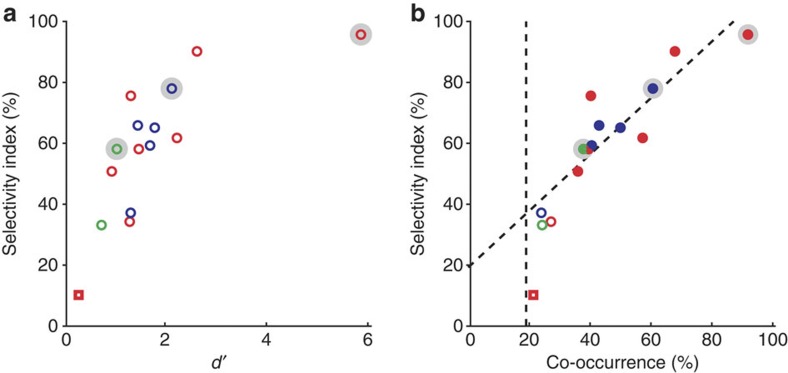
Figure 5. Selectivity and co-occurrence of HFB activity.
In both panels, markers in red, blue and green represent electrodes from participants P1, P2 and P3, respectively. For each participant, the electrode with the highest d′-value is marked with a shaded halo. The red square marker in each plot represents the control electrode also shown in Fig 2f. (a) Selectivity index values increase in parallel with d′-values (n=14, Spearman’s rank correlation, r=0.8, P=0.0007). (b) Co-occurrence values for the HFB increase in the experimental condition are also correlated with the selectivity index values. Electrodes with higher selectivity index during experimental condition showed higher co-occurrence of HFB peaks during experimental arithmetic condition (n=14, Pearson’s correlation, r=0.9, P=1e−5).

