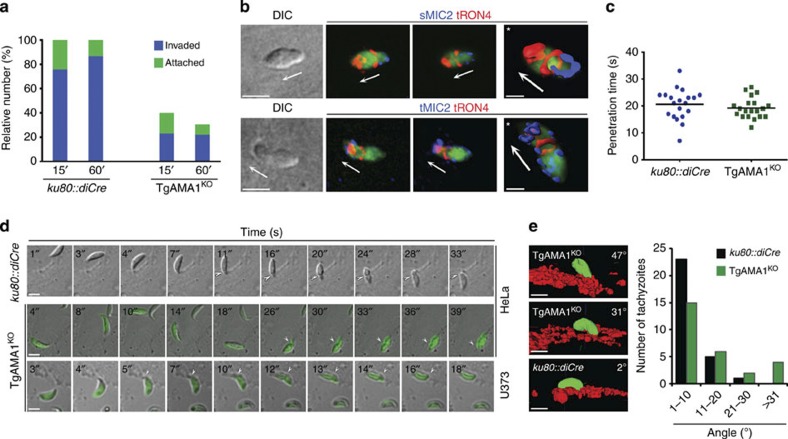
Figure 3. Host cell invasion by TgAMA1KO tachyzoites.
(a) Red/green invasion assay. Attached and invaded parasites were numerated and normalized to total number of ku80::diCre. Data show mean of a representative assay out of three independent experiments. At least 400 tachyzoites were counted for each strain. (b) Invading parasites stained with antibodies against the surface (sMIC2) or total (tMIC2) micronemal protein MIC2, and with anti-RON4 antibodies to mark the TJ. Scale bars, 5 μm. The right panels (*) show processed three-dimensional (3D) images. Scale bars, 2 μm. Arrows indicate the direction of movement. (c) Penetration kinetics. Twenty independent events for each strain were recorded by time-lapse microscopy. (d) Time lapses of ku80::diCre (upper row) or TgAMA1KO (green, bottom rows) tachyzoites invading epithelial cells (cell types are indicated on the right). Numbers indicate seconds and the white arrows show the constriction sites, characteristic of TJ formation. Scale bars, 5 μm. (e) 3D reconstruction of the positioning of ku80::diCre or AMA1KO tachyzoites with labelled SAG-1 (green) attached to host cells expressing a fluorescent marker at the plasma membrane (red). Scale bars, 5 μm. The plot shows the angle of the parasite in relation to the mCherry-expressing host cell membrane measured for 50 tachyzoites of each strain. DIC, differential interference contrast.

