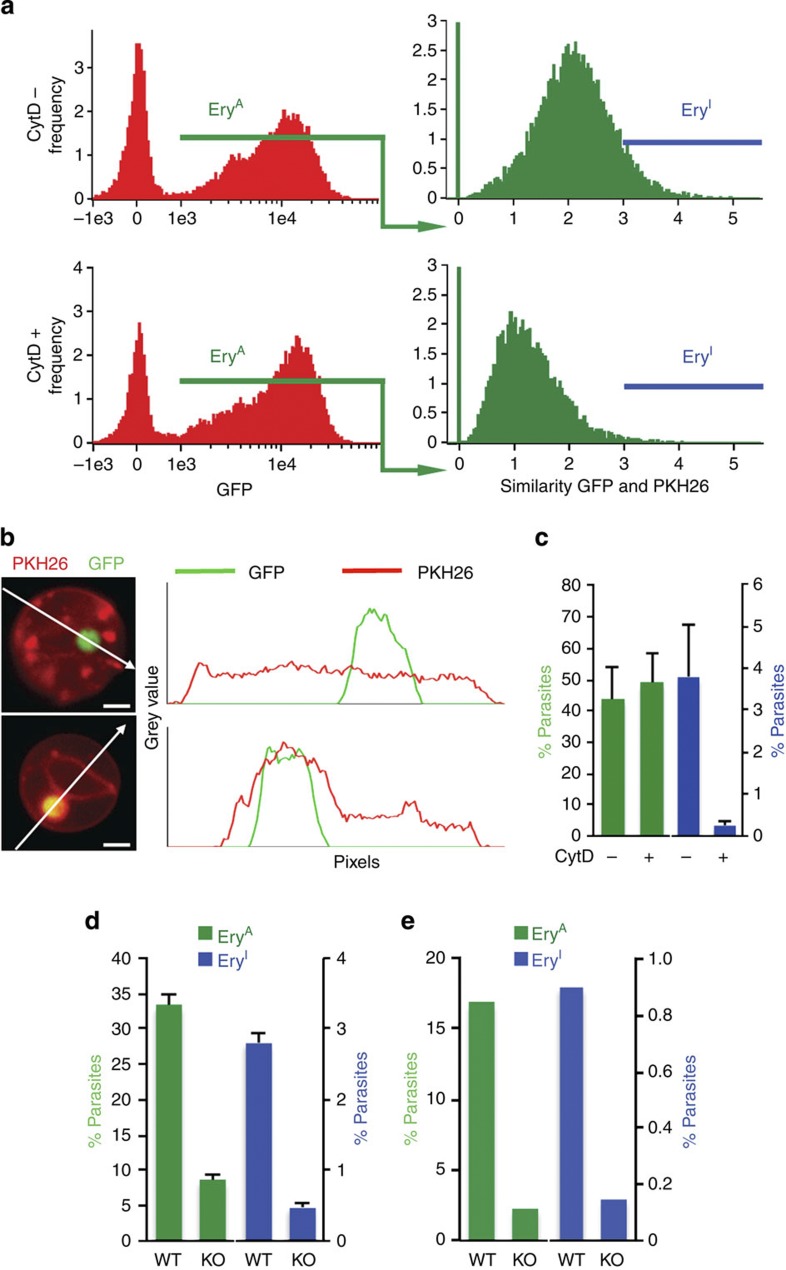
Figure 5. IFC analysis of erythrocyte invasion by AMA1KO merozoites.
(a) WT GFP+ merozoites isolated from blood cultures were incubated with PKH26-stained erythrocytes in normal conditions (top panels) or with 1 μM cytochalasin D (bottom panels). Left panels: plots of GFP intensity in the erythrocyte population. Cells associated with a merozoite (GFP+) are gated as EryA (green gate), and invaded cells are gated as EryI using an algorithm recognizing merozoites associated with a tight-fitting PV (blue gate). (b) PKH26-stained erythrocytes non-invaded (top) or invaded by a merozoite surrounded by the duplication of PKH26 upon PV formation (bottom). A plot of the mean grey value of PKH26 (red) and GFP (green) signals per pixel is shown on the right of each image. The white arrows show the path of measured pixels. Scale bars, 2 μm. (c) Quantification of EryA (green) and EryI (blue) populations in the assay described in a represented as percentages of parasites from initial input. Results are mean±s.d. from three independent experiments. (d) EryA (green) and EryI (blue) scored for WT or AMA1KO merozoites isolated from blood cultures and incubated with erythrocytes for 10 min. Data show mean±s.d. of triplicates, representative of two independent experiments. (e) EryA (green) and EryI (blue) scored for WT or AMA1KO merozoites isolated from blood cultures and incubated with erythrocytes for 3 min. Data show the mean of two independent experiments. KO, knockout.

