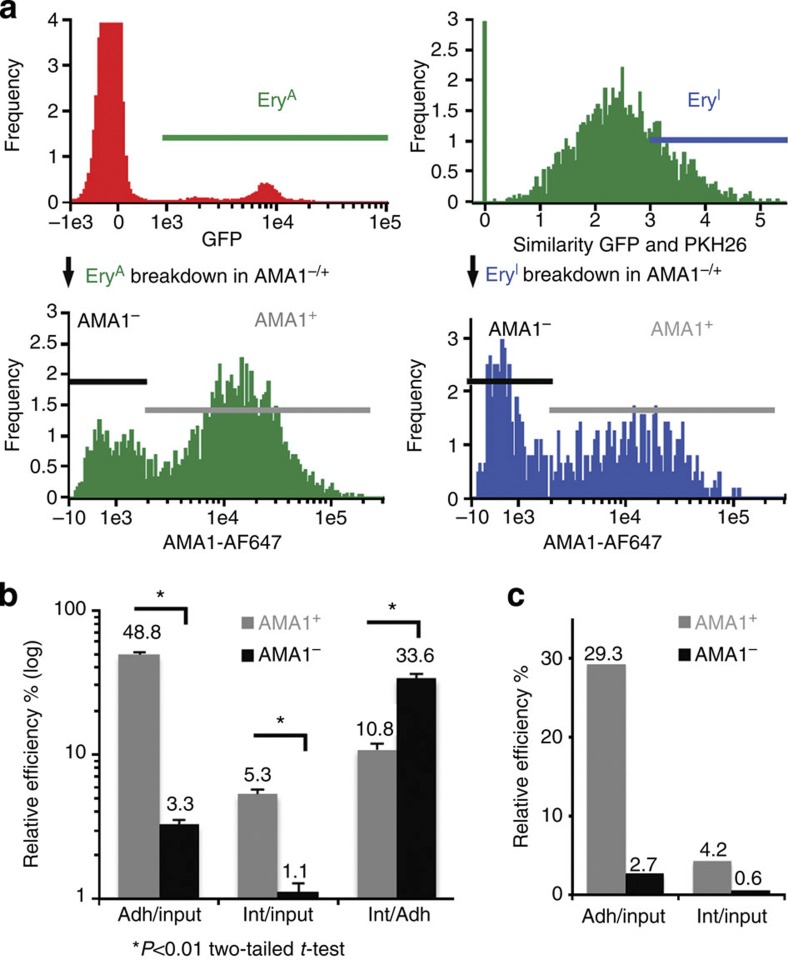
Figure 7. IFC analysis and quantification of erythrocyte invasion by AMA1KD merozoites.
(a) EryA and EryI populations (top panels) after 10 min incubation of the AMA1KD merozoites with PKH26-stained erythrocytes. Bottom panels show the breakdown of EryA and EryI events in AMA1+ (grey) and AMA1− (black) parasites, as measured by intensity plot of AMA1 stained with Alexa-Fluor 647 (AMA1-AF647). (b) Quantification of AMA1+ (grey) and AMA1− (black) parasites in the EryA and EryI populations after 10 min incubation, represented as percentages of initial input parasites (Adh/Input and Int/Input, respectively), and in the EryI population as percentage of adherent (EryA) parasites (Int/Adh). Results are mean±s.d. from three independent experiments. *P-value <0.01 in two-tailed Student’s t-test. (c) Quantification of AMA1+ (grey) and AMA1− (black) parasites in the EryA and EryI populations after 3 min incubation, represented as percentages of initial input parasites (Adh/Input and Int/Input, respectively). Data show the mean of two independent experiments.

