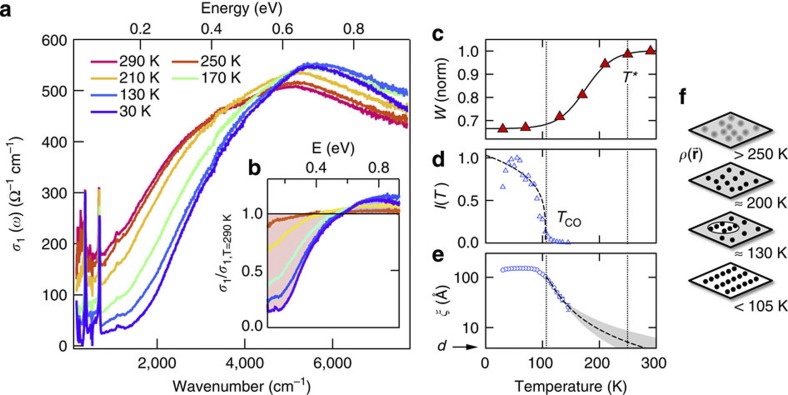
Figure 1. Equilibrium optical conductivity and charge-order correlations.
(a), In-plane optical conductivity σ1(ω) of LSNO (x=0.25) at different temperatures, and (b), data normalized to the T=290 K room temperature conductivity. The shaded area indicates the difference between the normalized conductivities at room temperature and at 30 K. (c) Temperature dependence of spectral weight below 0.6 eV, revealing a smooth crossover below T*≈250 K. Line: guide to the eyes. (d,e) Intensity and in-plane correlation length obtained from XRD from the charge-ordering superlattice at q=(0.554,0,1). The correlation length is plotted on a log scale to elucidate the high-temperature trend. Dashed lines are the fits with critical scaling laws25 for the intensity I(T) [(Tco−T)/Tco]2β with β=0.17±0.07 and correlation length ξ(T)
 [(T−Tco)/Tco]−v with v=1.47±0.15, where the statistical error represents the 95% confidence interval in extracting the fitting parameters. Within the experimental accuracy, the value of the exponent v is compatible with a 2D percolative model25, where v=1.32. Shaded area: critical model extrapolation with twice the error bars on the fitting parameters to include possible deviations from the critical scaling law at higher temperatures. (f) Sketch of real-space charge density distribution in the Ni-O plane at different temperatures.

