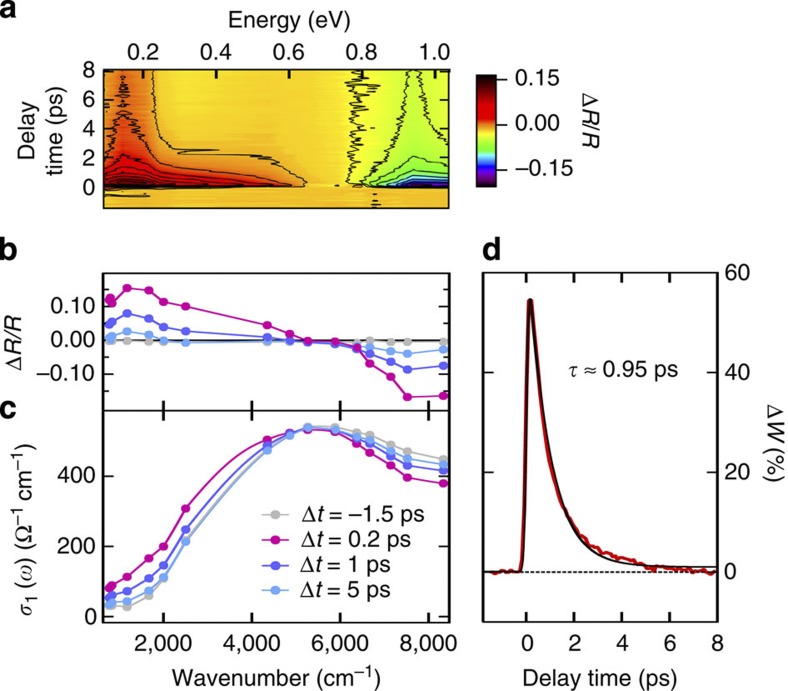
Figure 3. Mid-infrared pseudogap dynamics.
(a) Transient reflectivity variations ΔR/R as a function of energy and time delay measured at 30 K and for 1 mJ cm−2 absorbed pump fluence. Contour lines (black) are indicated in steps of 0.02. (b) Spectral cuts of photo-induced reflectivity variations ΔR/R at representative time delays Δt, and (c) the resulting spectra of the transient conductivity σ1(ω,Δt). (d) Transient change ΔW(t) of the low-energy spectral weight W, normalized to its full-scale variation upon heating from 30 to 290 K. Solid line: exponential decay fit with τ=950 fs convoluted with the pulse temporal profile.

