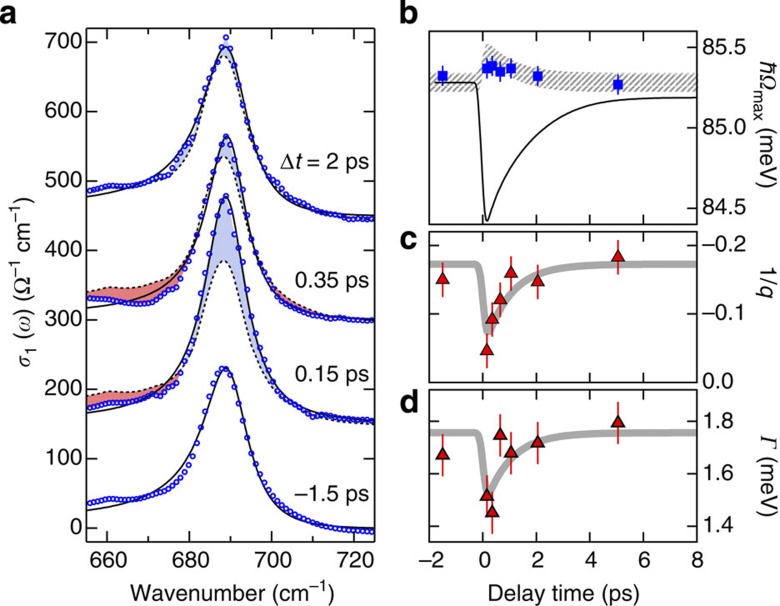
Figure 4. Ultrafast suppression of electron–phonon coupling.
(a) Non-equilibrium optical conductivity around the Ni-O stretching mode (circles) at representative delay times after photoexcitation at 30 K and for 1 mJ cm−2 absorbed pump fluence. Dashed lines: equilibrium conductivity, solid lines: Fano model. Blue and red shaded regions indicate a transient increase or decrease, respectively, of the conductivity. (b) Dynamics of the Ni-O mode peak energy Ωmax (squares), compared with that expected for direct coupling between the electronic spectral weight and equilibrium phonon shift as explained in the text (solid line). Hatched area: transient peak energy Ωmax(t)=Г(t)/q(t)+Ωph (T=30 K) expected from the Fano model, taking into account the fits in panels (c,d) and their corresponding uncertainties (95% confidence interval). (c,d) Dynamics of the Fano coupling parameter 1/q and the phonon linewidth Г (symbols), along with model curves (thick lines) with a single-exponential decay time fixed to τ=950 fs as obtained from the spectral weight dynamics in Fig. 3d. Error bars represent the 95% confidence interval in extracting the fitting parameters and include possible uncertainties because of the background subtraction procedure (See Supplementary Methods).

