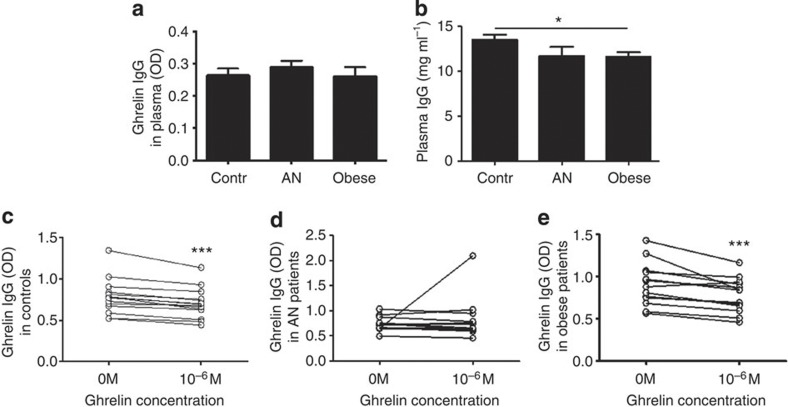
Figure 2. Ghrelin-reactive IgG and total IgG in humans.
Plasma levels of ghrelin-reactive IgG (a). Plasma concentrations of total IgG (b) measured by the nephelometry. Plasma levels in optical density (OD) of ELISA of ghrelin-reactive IgG before and after absorptions of plasma with 10−6 M ghrelin in control subjects (c), AN patients (d) and obese (e). Absorption was efficient in controls and the obese but not in AN patients, probably due to increased dissociation properties of some AN patients’ IgG (Fig. 4f). (b) Student’s t-test *P<0.05; (c,e) Paired t-tests, ***P<0.001. (Contr. n=14, AN n=12 and obese n=14, error bars, s.e.m.).

