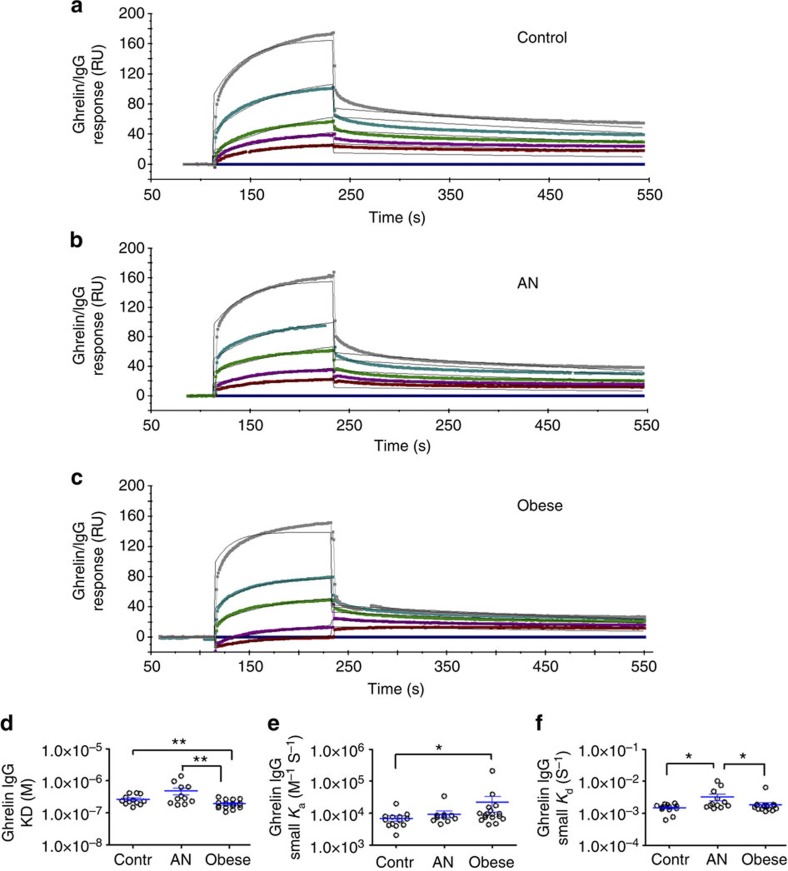
Figure 4. Affinity kinetics between human ghrelin and IgG assayed by SPR.
Affinity kinetics were analysed by the Langmuir’s 1:1 model fit on five serial dilutions of IgG from 0.5 mg ml−1 and flow speed of 30 μl min−1. Representative examples of curve fits for the affinity kinetic analysis of a control subject (a), AN (b) and obese (c) patients. The affinity kinetics parameters of the given examples are the following: (a) small ka (±s.e.m.), 9.17 × 10³±1.09 × 10² M−1 s−1, small Kd (±s.e.m.), 1.37 × 10⁻³±3.14 × 10⁻⁵ s−1, KD, 1.50 × 10⁻⁷ M, χ2 21.1; (b) small Ka (±s.e.m.), 8.76 × 10³±1.17 × 10² M−1 s−1, small Kd (±s.e.m.), 1.78 × 10⁻³±3.52 × 10⁻⁵ s−1, KD, 2.03 × 10⁻⁷ M, χ2 13.7 and (c) small Ka (±s.e.m.), 1.71 × 10⁴±2.53 × 10² M−1 s−1, small Kd (±s.e.m.), 1.77 × 10⁻³±3.98 × 10⁻⁵ s−1, KD, 1.04 × 10⁻⁷ M, χ2 12.3. Affinity for ghrelin of IgG in obese patients was increased compared to controls and AN patients as represented by lower mean KD values in obese (d). Association (Ka) and dissociation (Kd) rates are shown in (e) and (f), respectively. (d) K–W test, P=0,004, Dunn’s **P<0.01 AN versus obese, Student’s t-test **P<0.01 controls versus obese; (e) K–W test, P=0.03, Dunn’s *P<0.05; (f) K–W test, P=0,034, Dunn’s *P<0.05 controls versus AN, M–W test, *P<0.05 AN versus obese. (Contr. n=14, AN n=12 and obese n=14, error bars, s.e.m.).

