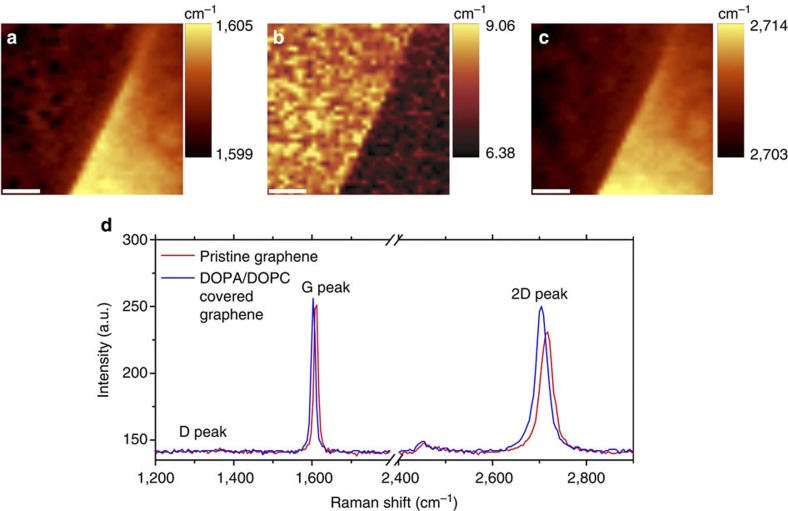
Figure 5. Raman spectroscopy of lipids on graphene.
(a–c) Raman maps across the boundary of a lipid membrane, showing lipid-covered graphene on the left half and pristine graphene on the right half. (a) G-peak position, (b) G-peak full width at half maximum, (c) 2D-peak position. Scale bar, 2 μm (a–c). (d) Representative Raman spectra from lipid-covered and pristine graphene regions showing the downshift and narrowing of G peak and of 2D peak arising from interaction with the n-doping lipid.

