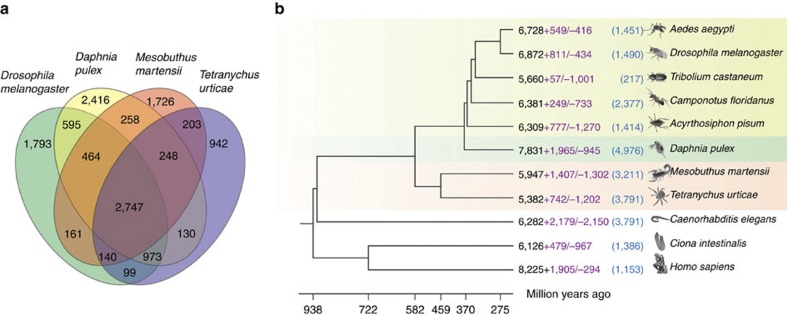
Figure 1. Comparative analyses of the M. martensii genome.
(a) Venn diagram of shared and unique gene families between D. melanogaster, D. pulex, M. martensii and T. urticae. Clusters of orthologous and paralogous gene families are identified by OrthoMCL53. (b) Gene gain-and-loss analysis of species across arthropods, nematode and chordates. The branching and the divergence times between lineages are derived from the TimeTree database54, and are marked with a scale in million years at the bottom. For each species, total gene families (black), the numbers of gene family gain (+) and loss (−) (purple), and orphan genes (blue) are indicated (Supplementary Note 2).

