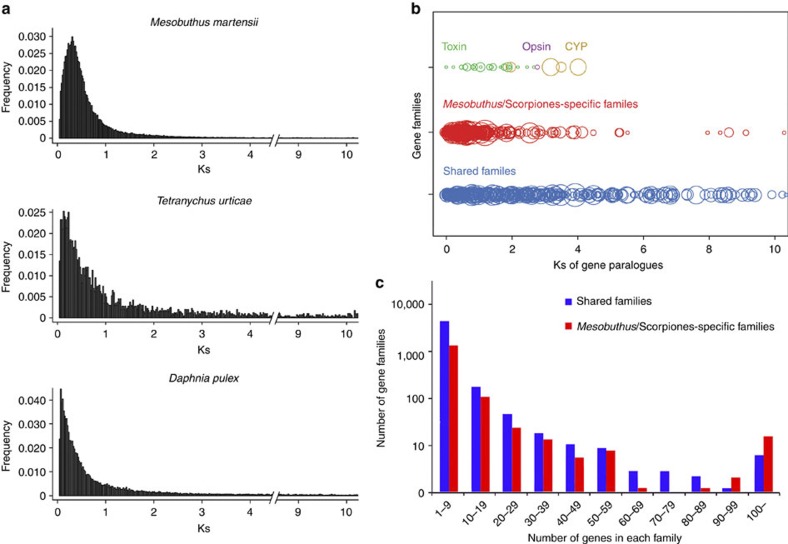
Figure 2. Gene family expansion and evolution.
(a) Frequency of pair-wise genetic divergence at silent sites (Ks) among gene paralogues from M. martensii, T. urticae and D. pulex. The Ks values for gene pairs with >70 aligned amino acids and identity >70% are calculated using codeml PAML package50. (b) Ks distribution of the shared, Mesobuthus lineage-specific, and three functional gene families. Each circle represents a gene family, and the size of a circle signifies the member count of a corresponding family. (c) Distribution of the shared and Mesobuthus lineage-specific gene family sizes.

