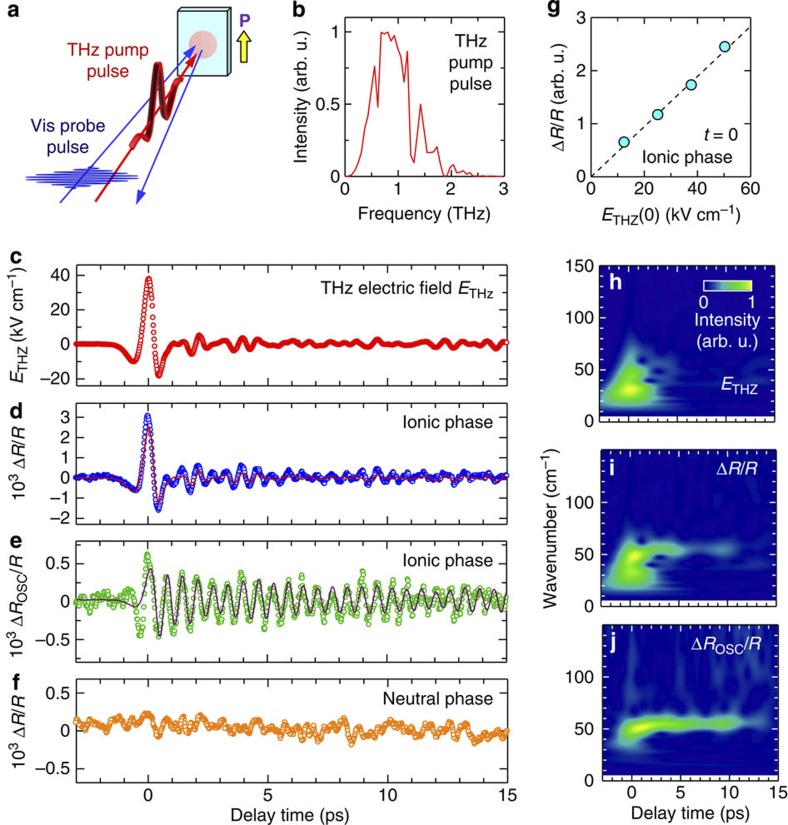
Figure 2. THz-pump optical-probe measurements of TTF-CA.
(a) Schematic of setup. (b) Spectrum of the THz-pump pulse. (c) Waveform of THz field [ETHz(t)] set parallel to the a axis. (d) Time evolution of ΔR/R for Er⊥a at 78 K in the ionic phase and the normalized ETHz(t) (solid line). (e) Oscillatory component ΔROSC(t)/R and fitting curve (solid line). (f) Time evolution of ΔR/R at 82 K in the neutral phase. (g) ETHz(0) dependence of maximum ΔR/R values at t=0 ps and at 78 K in the ionic phase. (h–j) Time-dependent Fourier power spectra of (h), ETHz(t) (i), ΔR/R and (j) ΔROSC/R, respectively.

