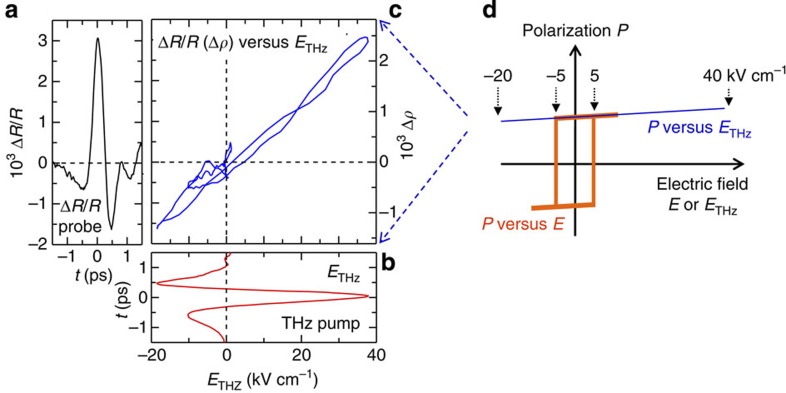
Figure 3. Changes of the polarization P by the THz field in TTF-CA.
(a) Time evolution of the reflectivity change ΔR/R at 2.2 eV (Er⊥a) induced by the THz electric field ETHz in the ionic phase (78 K) for the delay time t of −1.5 ps≤t≤1.5 ps. ΔR/R reflects the change (Δρ) of the degree of charge transfer ρ for the delay time. (b) Time evolution of ETHz for −1.5 ps≤t≤1.5 ps. (c) ΔR/R as a function of ETHz derived from a and b. The right vertical axis denotes Δρ, which corresponds to the change (ΔP) of the polarization P (see the text). (d) Schematics of the P−E curves for the THz electric field ETHz (blue line) and for the quasi-static electric field E (orange line). The former was deduced from a–c; see the text). Coercive field for an electric field with 10 Hz is ±5 kV cm−1 at ~50 K (ref. 9).

