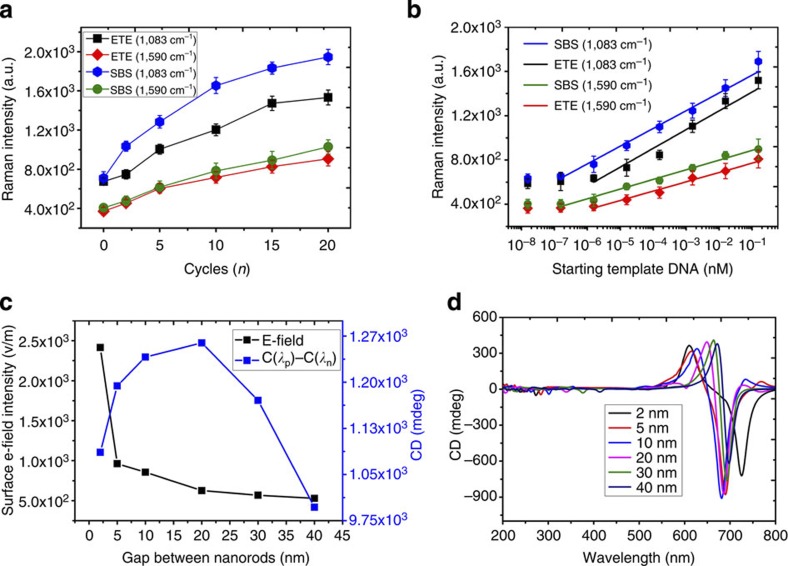
Figure 5. DNA analysis using SERS capabilities.
(a,b) SERS intensity of 4-ATP tag at 1,083 cm−1 and 1,590 cm−1 for ETE and SBS NR assemblies obtained after different n (a) and different starting DNA concentrations (b). (c) Calculated dependence of the intensity of the surface E-field and CD intensity for a NR pentamers with gaps of 2, 5, 10, 20, 30 and 40 nm. (d) Calculated CD spectra for NR pentamers with gaps of 2, 5, 10, 20, 30 and 40 nm. The error bars represent the standard deviation of sample measurements.

