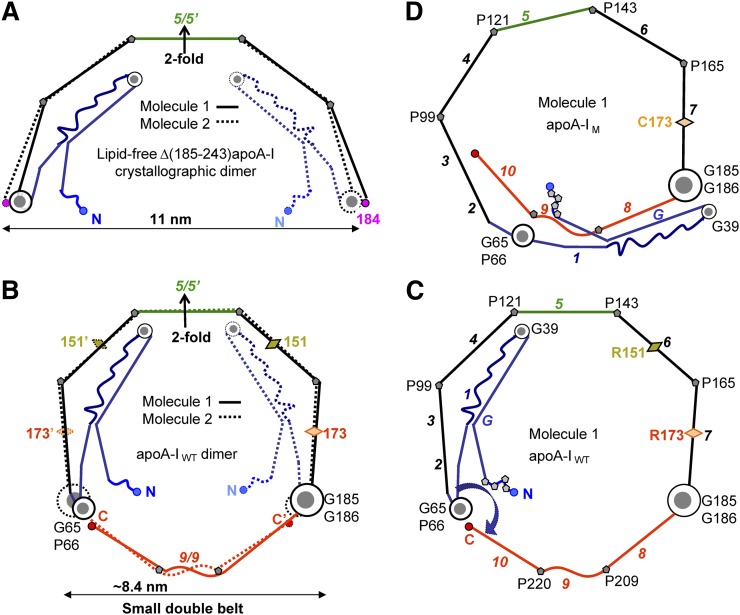
Fig. 2.
Proposed models of the small double belts of apoA-IWT (B, C) and apoA-IM (D) that were derived by using as a starting model the 2.2 Å resolution X-ray crystal structure of Δ(185–243)apoA-I (PDB ID 3R2P) (53). The models in these and other figures are drawn to scale and represent idealized planar double belts viewed down the normal to the plane. The conformational changes, which we propose are involved in the adaptation of the 3D protein structure to lipid-surface binding, including opening of the four-segment bundle, have been described previously (9, 53). (A) Left panels show molecular dimers comprised of Molecule 1 (solid lines) and Molecule 2 (dashed lines), and right panels show only Molecule 1. Sequence repeats are color-coded as follows: blue, N-terminal repeats G-1 (residues 1–65); black, repeats 2–7 (residues 66–185), except for the central repeat 5 (residues 121–143, in green); red, C-terminal repeats 8–10 (residues 186–243). Sequence repeats (shown in Fig. 1) are numbered in italics in (C) and (D). Pro positions are marked, and key Gly-containing flexible hinges are shown in gray-and-white circles: G185-G186 (largest circle), G65-P66 (medium circle), G39 (smallest circle). Locations of Milano and Paris mutations R173C and R151C are shown by diamonds.

