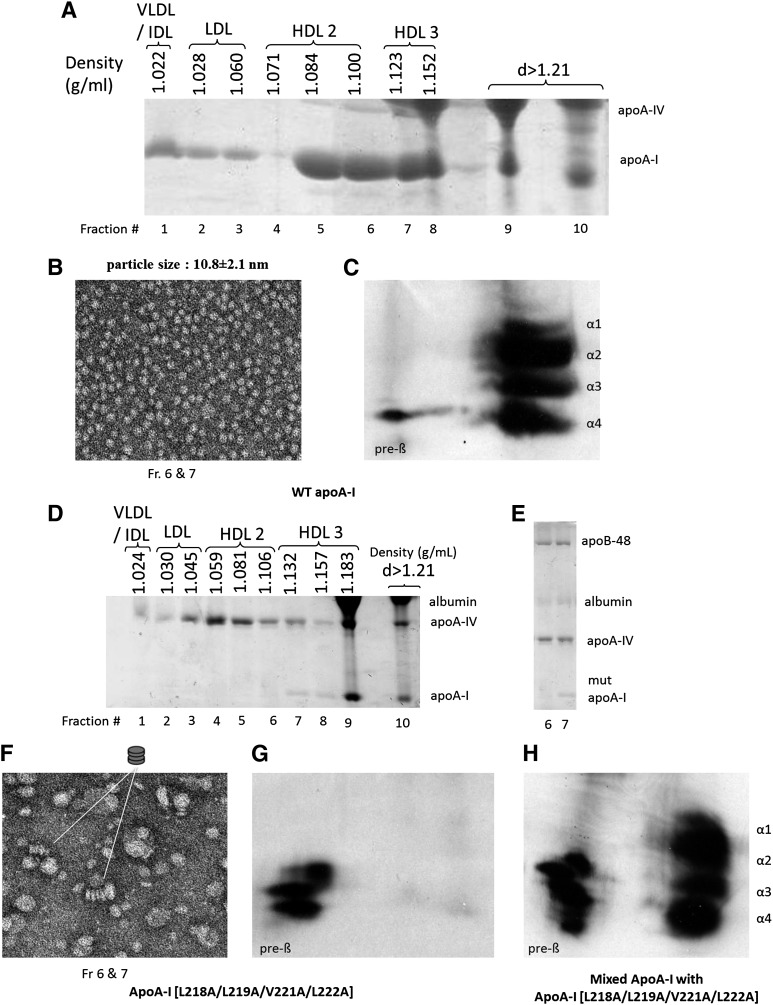
Fig. 3.
Analysis of plasma of apoA-I−/− × apoE−/− mice infected with adenoviruses expressing WT apoA-I (A) or apoA-I[218–222] mutant (D) by density gradient ultracentrifugation and SDS-PAGE. EM analysis of HDL fractions 6 and 7 obtained from apoA-I−/− × apoE−/− mice expressing the WT apoA-I (B) or apoA-I[218–222] mutant (F) following density gradient ultracentrifugation of plasma as indicated. The photomicrographs were taken at 75,000× magnification and enlarged three times. E: SDS gel electrophoresis showing lipoprotein composition of fractions 6 and 7. These fractions were used for EM analysis in F. Two-dimensional gel electrophoresis of plasma of apoA-I−/− × apoE−/− mice infected with adenoviruses expressing WT apoA-I (C), apoA-I[L218–222] mutant (G), or mixture of samples obtained from mice expressing WT apoA-I and apoA-I[218–222] mutant (H).

