Fig. 3.
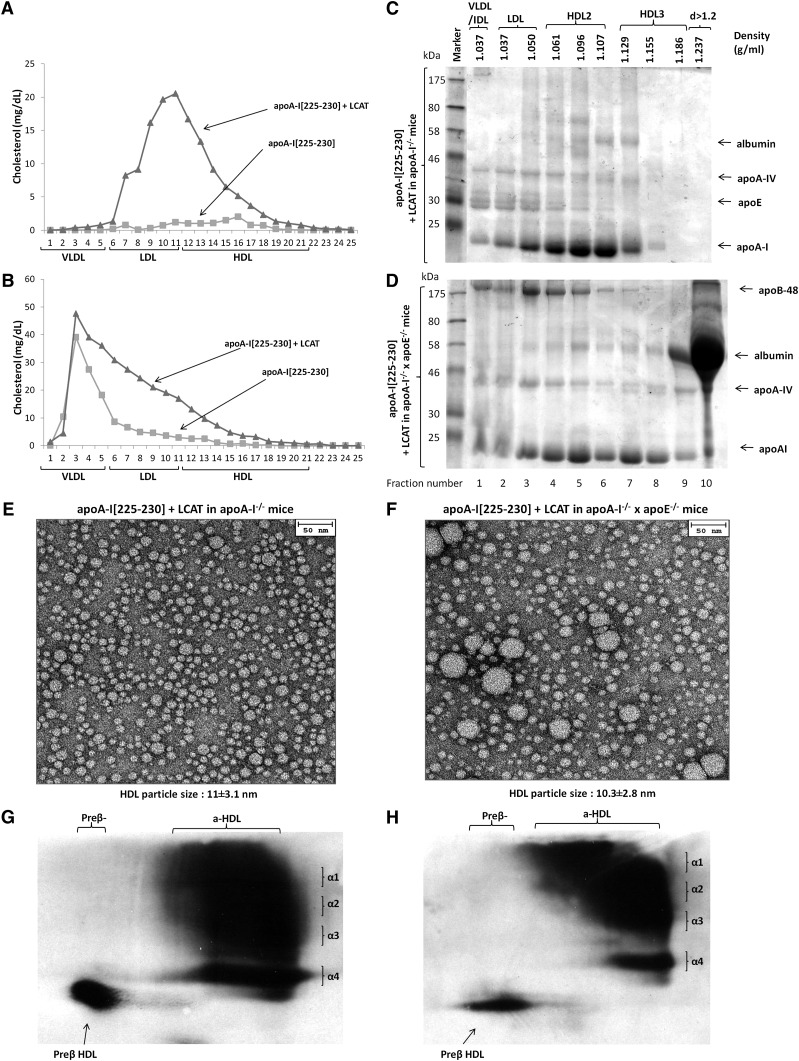
Analyses of plasma of apoA-I−/− (A,C,E,G) or apoA-I−/− × apoE−/− mice (B, D, F, H) infected with adenoviruses expressing the apoA-I[225–230] mutant in combination with human LCAT. Plasma FPLC profiles of mice expressing the apoA-I[225–230] mutant alone or the apoA-I[225–230] mutant in combination with human LCAT in apoA-I−/− (A) or apoA-I−/− × apoE−/− background (B). SDS-PAGE of fractions obtained by density gradient ultracentrifugation from apoA-I−/− (C) or apoA-I−/− × apoE−/− mice (D) mice expressing the apoA-I[225–230] mutant and human LCAT. EM analysis of HDL fractions 6 and 7 obtained from apoA-I−/− (E) or apoA-I−/− × apoE−/− (F) mice expressing the apoA-I[225–230] mutant and human LCAT following density gradient ultracentrifugation of plasma as indicated. Two-dimensional gel electrophoresis of plasma of apoA-I−/− (G) or apoA-I−/− × apoE−/− (H) mice expressing the apoA-I[225–230] mutant and human LCAT .

