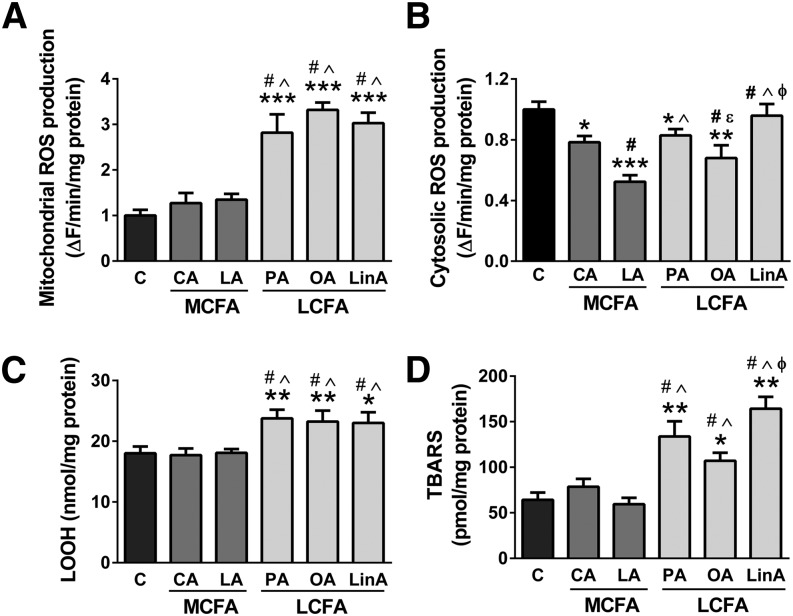
Fig. 2.
Oxidative stress markers in C2C12 myotubes. Mitochondrial (A) and cytosolic (B) superoxide generation, lipid hydroperoxide (C) and TBARS (D) levels in muscle cells treated with various MCFAs and LCFAs (18 h incubations with 200 μM FAs). Shown are means ± SEM, n = 3 with three replicates each [or n = 4 with two replicates each in the case of panel (B)]. *P < 0.05, **P < 0.01, and ***P < 0.001 versus C; #P < 0.01 versus CA; ^P < 0.01 versus LA; εP < 0.05 versus PA; φP < 0.01 versus OA. C, control; CA, capric acid; LA, lauric acid; PA, palmitic acid; OA, oleic acid; LinA, linoleic acid

