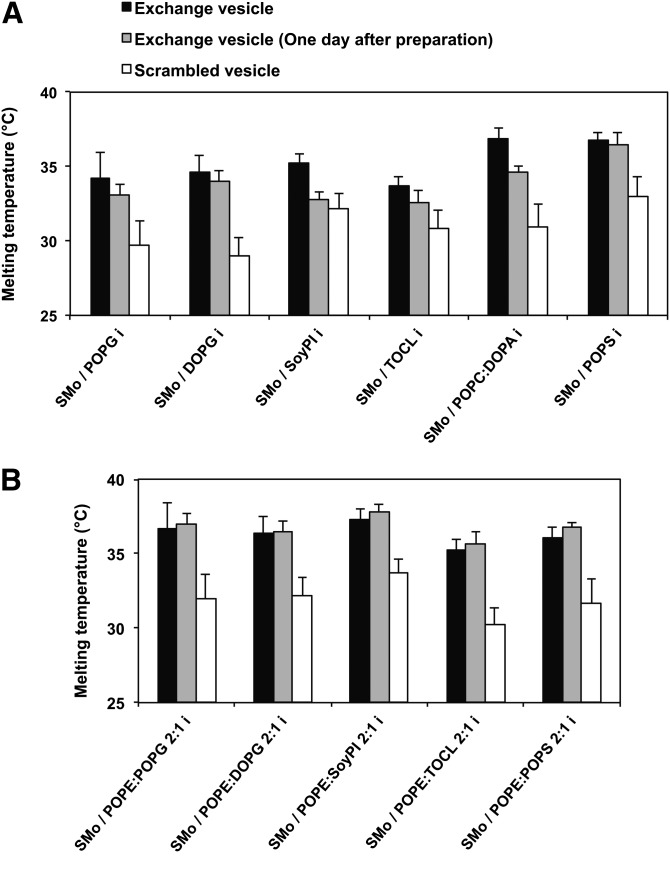
Fig. 2.
The gel to fluid melting midpoint (Tm) of exchange and scrambled SUVs. A: SMo/Xi vesicles. B: SMo/2:1 POPE:Xi vesicles. The (X) indicates a lipid other than SM. Exchange vesicles (black bars); exchange vesicles 1 day after preparation (gray bars); and exchange vesicles after scrambling (white bars). Lipid composition of exchange vesicles is shown on the x axis. The steady-state DPH anisotropy measurements as a function of temperature were made on exchange vesicles both immediately after preparation and after 1 day of incubation at room temperature. The average (mean) and range (if n = 2) or SD are shown. The number of samples is the same as shown in Table 2.

