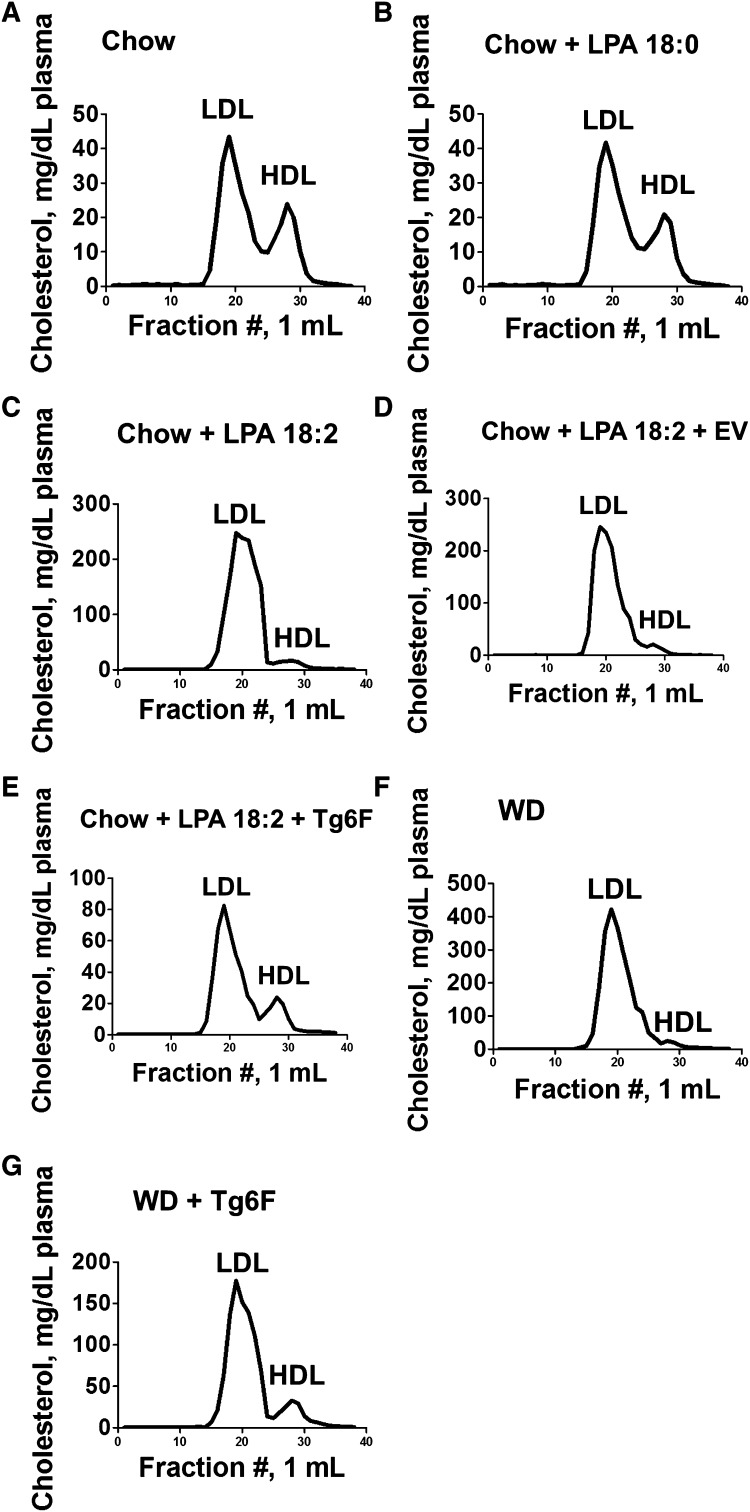
Fig. 13.
FPLC cholesterol profiles of plasma taken from the mice described in Fig. 12. Plasma was collected from five randomly selected mice from each of the groups described in Fig. 12. An equal volume of plasma (200 μl) from each mouse was pooled in each group and FPLC cholesterol profiles were determined as described in Materials and Methods.

