Fig. 2.
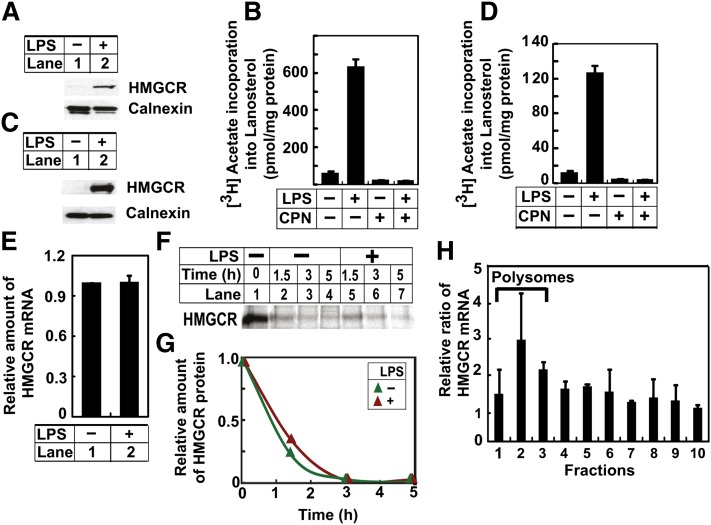
LPSs induce HMGCR protein expression in macrophages. A, B: On day 0, peritoneal macrophages were seeded at 5 × 10⁶ cells per 60 mm dish. A: On day 1, cells were treated with (+) or without (−) 200 ng/ml LPSs for 8 h. The amount of HMGCR protein in the cells was then determined by immunoblot analysis. B: On day 1, cells were treated with 200 ng/ml LPSs and 25 μM compactin (CPN) as indicated for 8 h. These cells were then labeled with 10 μCi [3H]acetate in the presence of 0.5 mM unlabeled acetate for 2 h, and the amount of the radioactivity incorporated into lanosterol was determined as described in Experimental Procedures. C–H: On day 0, RAW264.7 cells were seeded at 3.5 × 10⁵ cells per 60 mm dish. C, E: On day 3, cells were treated with 200 ng/ml LPSs. On day 4, 24 h after the treatment, the amount of HMGCR protein was determined by immunoblot analysis (C), and the amount of its mRNA was determined by RT-QPCR (result is reported as mean ± SE. from triplicate measurements of a representative experiment) (E). D: On day 3, cells were treated with 200 ng/ml LPSs and 25 μM compactin (CPN) as indicated for 16 h, and synthesis of lanosterol was determined as described in (B). F: On day 4, cells were pulse-labeled with 150 μCi/ml 35S-protein labeling mix for 1 h and then chased with unlabeled methionine (0.5 mM) and cysteine (1 mM) in the absence or presence of 200 ng/ml LPSs for the indicated period of time. HMGCR was then immunoprecipitated from the cell lysate, and detected by SDS-PAGE followed by 35S autoradiography. G: Quantification of the result shown in (F) with the intensity immediately prior to chasing set to one. H: On day 3, cells were treated with 200 ng/ml LPSs. On day 4, 24 h after the treatment, cells were harvested for polysome fractionation analysis as described in Experimental Procedures. Value in each fraction represents the amount of HMGCR mRNA in cells treated with LPSs relative to that in untreated cells. P < 0.05 for comparison of the average value from fractions 1–3 versus that in fractions 4–10 with one-tailed unpaired t-test. A–G: Unless otherwise indicated, bar graphs are presented as mean ± SE from three independent experiments.

