Fig. 2.
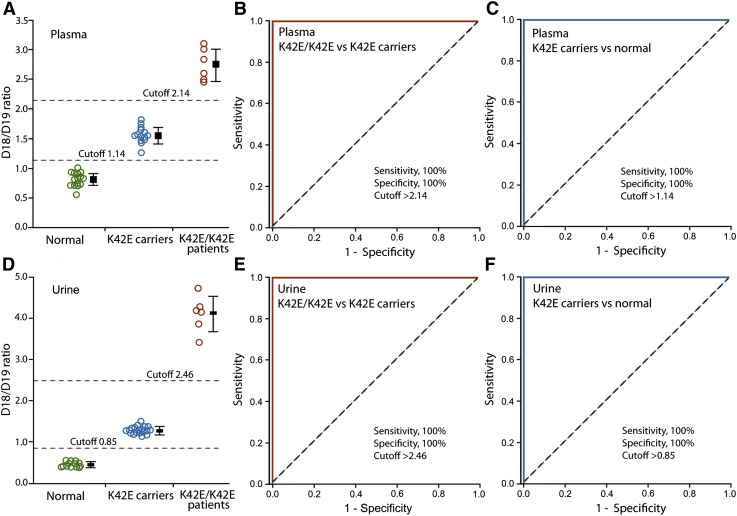
Plasma and urinary D18/D19 ratios in K42E/K42E patients, K42E carriers, and normal individuals. Plasma dolichol profiling was performed on 6 K42E/K42E patients, 25 K42E carriers, 16 normal individuals (A). ROC curve analysis shows that plasma D18/D19 ratios discriminate patients from carriers with 100% sensitivity and specificity (B), and carriers from normal individuals with 100% sensitivity and specificity (C). Urinary dolichol profiling was performed on 6 K42E/K42E patients, 30 K42E carriers, and 13 normal individuals (D). Urinary D18/D19 ratios also discriminate patients from carriers with 100% sensitivity and specificity (E), and carriers from normal individuals with 100% sensitivity and specificity (F). A bar representing the mean D18/D19 ratio (± SD) of each group is next to the plotted data (A and D). D18/D19 ratios are well separated among the three genotypic groups, with the separation being greater in urine than in plasma. The dotted diagonal lines indicate a reference line of AUC = 0.5 (B, C, E, and F).

