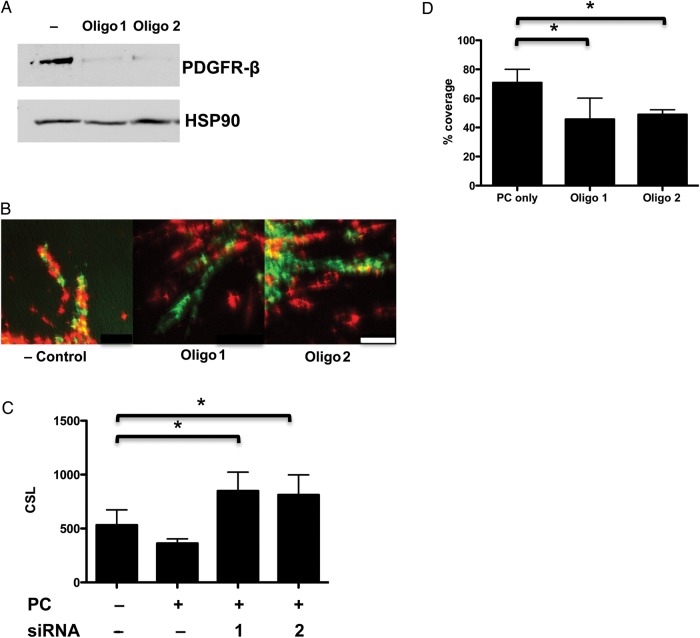
Figure 5.
Bcl-2-EC sprouts restrained by PDGFR-β-mediated interactions. PCs treated with negative control, PDGFR-β siRNA oligo 1, or 2. (A) Immunoblot of PC protein extracts detected with anti-PDGFR-β and HSP-90 as the loading control. (B) Confocal fluorescence images of mixed spheroids with 500 Bcl-2-ECs (PKH67 green-labelled cells) + 125 PCs (PKH26 red-labelled cells) treated with 100 ng/mL VEGF-A. The scale bar is 50 μm. (C) CSL and (D) percentage of Bcl-2-EC sprouts covered by PCs after PDGFR-β knockdown. The asterisk indicates a statistically significant difference by a two-tailed t-test with post hoc Bonferroni correction (P < 0.025 for D).

