Figure 6.
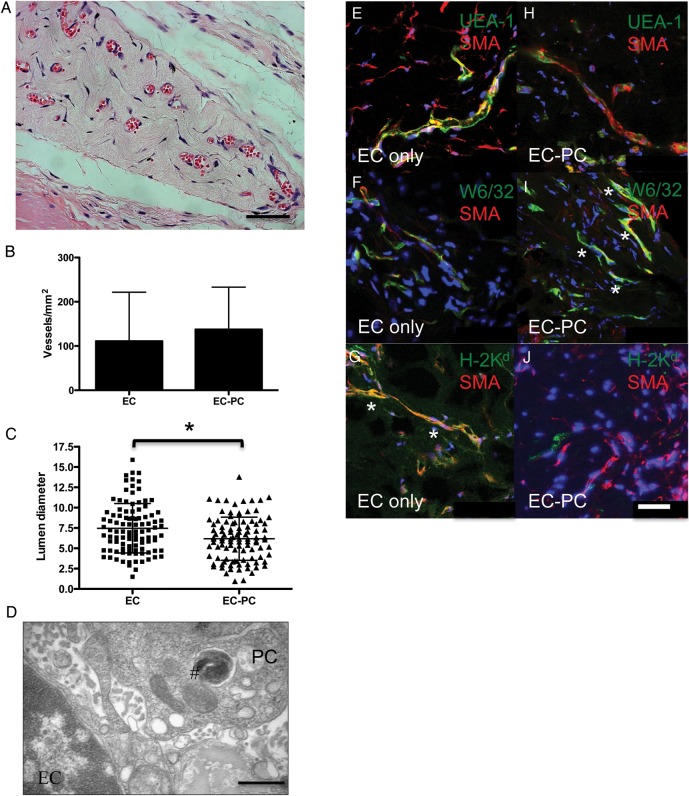
Microvessel formation from EC and EC-PC mixed spheroids in vivo. (A) Representative H&E staining of collagen gel implant from EC-PC mixed spheroids showing RBC perfusion. The scale bar is 50 μm. (B) Microvessel density ± SD from EC and EC-PC groups. (C) The scatter plot with mean ± SD of vessel diameters. The asterisk indicates a statistically significant difference between groups by a two-tailed t-test, P = 0.0015. (D) TEM of EC and PC interaction in a microvessel. #Iron-labelled endosome in PC. The scale bar is 1 μm. (E–J) Merged confocal images of fluorescence staining of vessels from (E–G) EC only and (H–J) EC-PC spheroids from frozen sections. (E and H) Human ECs stain with fluorescein isothiocyanate UEA-I (green) and mural cells with SMA (red). (F and I) Cells expressing human class I major histocompatibility complex (MHC) molecules (HLA-A, B) stain with mAb W6/32 (green). In vessels from (F) EC-only spheroids, W6/32 (green) and SMA (red) do not, but in (I) EC-PC spheroids W6/32 and SMA do co-localize. (G and J) Cells expressing mouse class I MHC molecules stain with H-2Kd (green). In vessels from (G) EC-only spheroids, H-2Kd (green) and SMA (red) do co-localize, but in (J) EC-PC spheroids do not. The asterisk highlights areas of co-localization. Hoechst staining in blue. The scale bar is 50 μm.

