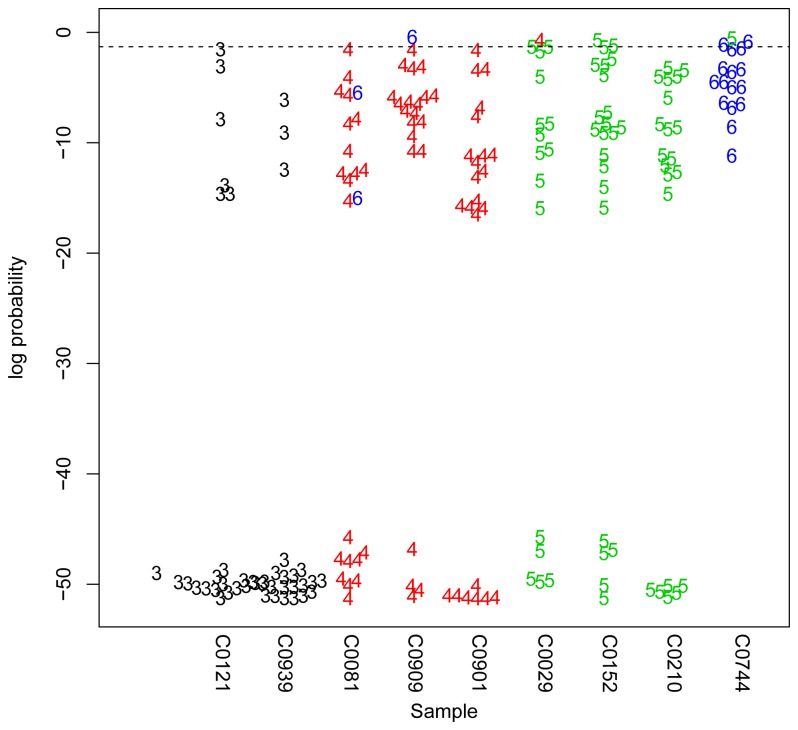
Figure 2. Positive control total FCGR3 copy number estimates from repeat tests.
The nine positive control DNA samples shown were repeated in every experiment and total FCGR3 copy number calculated. Each point represents an individual copy number measurement (as indicated by the colour and number), plotted on the y-axis representing the quality score as a log probability of the copy number being an alternative to the copy number shown. The dotted line shows the quality score threshold of 0.05, with samples below this threshold being accepted. The lower the point on the y-axis, the more confident we are of the copy number. 190 tests are shown, with 183 being below the quality threshold. Of these 183, 2 show the incorrect copy number, both in C0081 calling a 6 instead of a 4.

