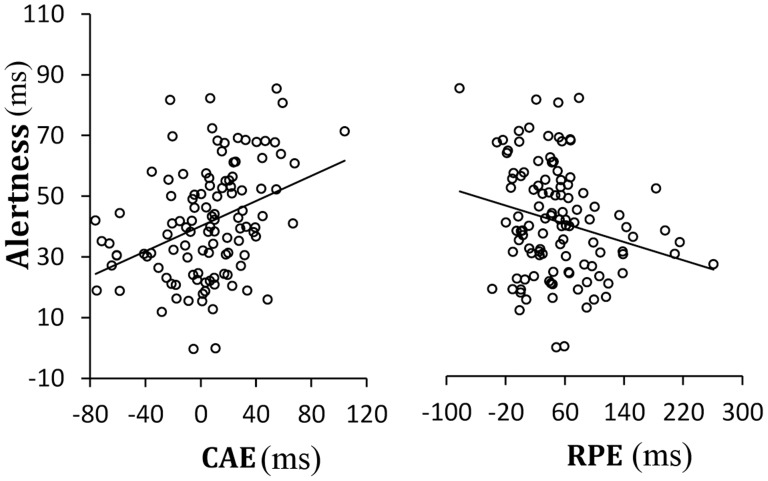
Figure 1. Scatter distribution in experiment 1.
Curve fit between the efficiency of alertness and the CAE, alertness and the RPE, alertness and the congruency effect, respectively. NB. CAE = conflict adaptation effect on change trials; RPE = repetition priming effect on response or stimulus-response (S-R) repetition trials.

