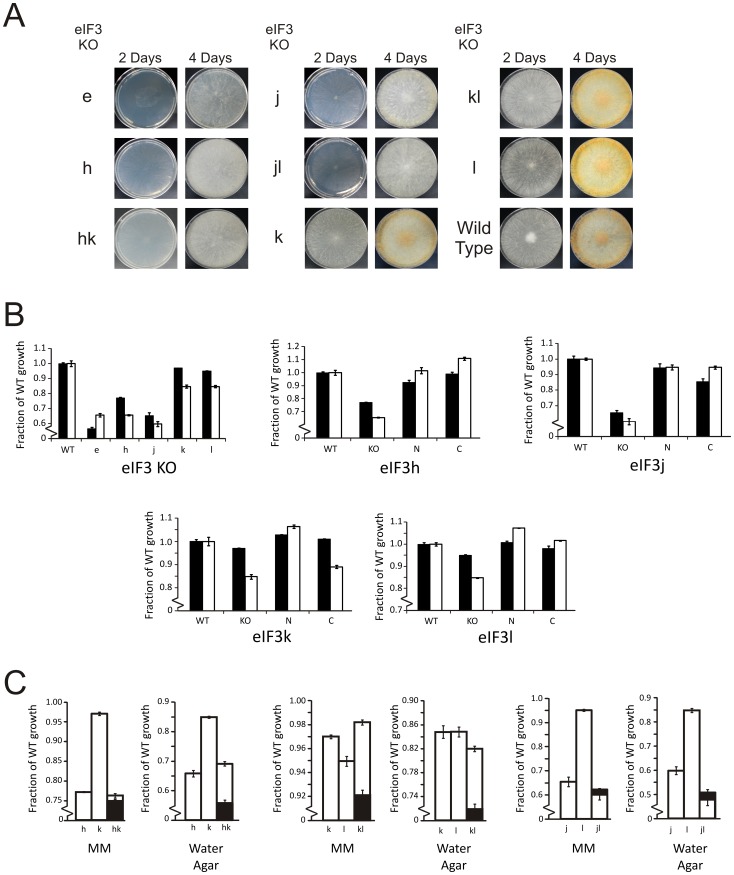
Figure 2. Viable Nc eIF3 knock-out strains display defects in conidiation and linear growth.
(A) Growth of Nc eIF3 single and double knock-out (KO) strains on Vogel’s minimal media (MM) with 2% sucrose. Plates were spotted from frozen stocks of the indicated eIF3 subunit single or double knock-out strain, grown in the dark and photographed on the indicated days. (B) Linear growth of Nc eIF3 knock-out strains on Vogel’s MM with 2% sucrose (black bars) or water agar (white bars). In all graphs linear growth is plotted as a fraction of wild-type growth on comparable media. Linear growth of wild-type (WT) on water agar as a fraction of MM with 2% sucrose is 0.63 (Table S2 in File S1). Linear growth of eIF3 single knock-out strains is compared to WT, where the eIF3 subunit knock-out is indicated below the bars (graph eIF3 KO). Linear growth of eIF3 knock-out compared to wild-type and the knock-out strain with an N-terminally tagged (N) or C-terminally tagged (C) recombinant eIF3 subunit at the his-3 locus (graphs eIF3h, j, k, l). The recombinant eIF3 subunit and corresponding KO strain is indicated below each graph. (C) Linear growth of eIF3 double knock-out strains compared to the corresponding single knock-outs (white bars) on Vogel’s MM with 2% sucrose and 2% agar or Vogel’s MM with 2% agar (water agar). Black bars represent the calculated multiplicative effect from both single knock-outs. Each graph has a broken vertical axis to visually emphasize the difference in linear growth rates. Error bars indicate the standard error on the mean. Numerical values for linear growth and errors are in Table S2 in File S1.

