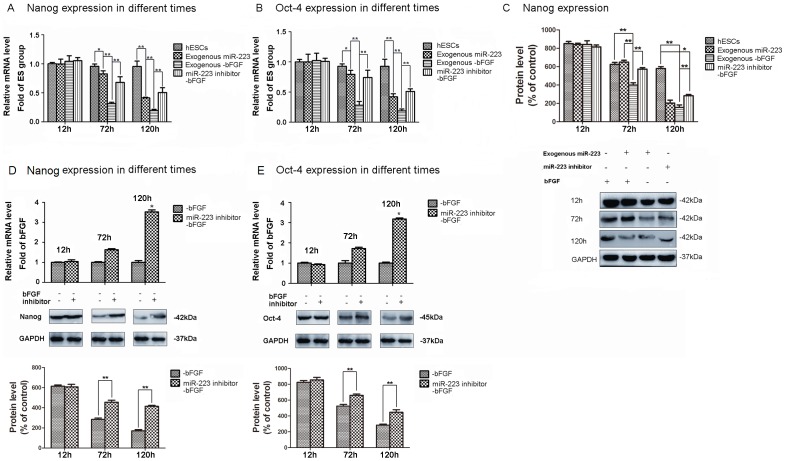
Figure 2. MiR-223 induces the differentiation of hESCs.
Using qRT-PCR, Nanog (A) and Oct-4 (B) mRNA levels were assayed in control cells, cells expressing exogenous miR-223 with and without bFGF withdrawal, and cells expressing a miR-223 inhibitor that underwent withdrawal of bFGF for 12, 72, and 120 h (*p<0.05, **p<0.01; n = 6). (C) Levels of Nanog were detected by western blot 12, 72, and 120 h after withdrawal of bFGF for the groups. Levels of mRNA and protein were also assayed for Oct-4 (D) and Nanog (E) in the presence or absence of an miR-223 inhibitor 12, 72, and 120 h after withdrawal of bFGF (*p<0.05, **p<0.01; n = 6). For western blots, detection of GAPDH was used as a loading control and protein bands were semi-quantified using imaging analysis software. Data are expressed as the mean ± SD and are representative of the three independent experiments that were performed. *p<0.05, **p<0.01, n = 3.

