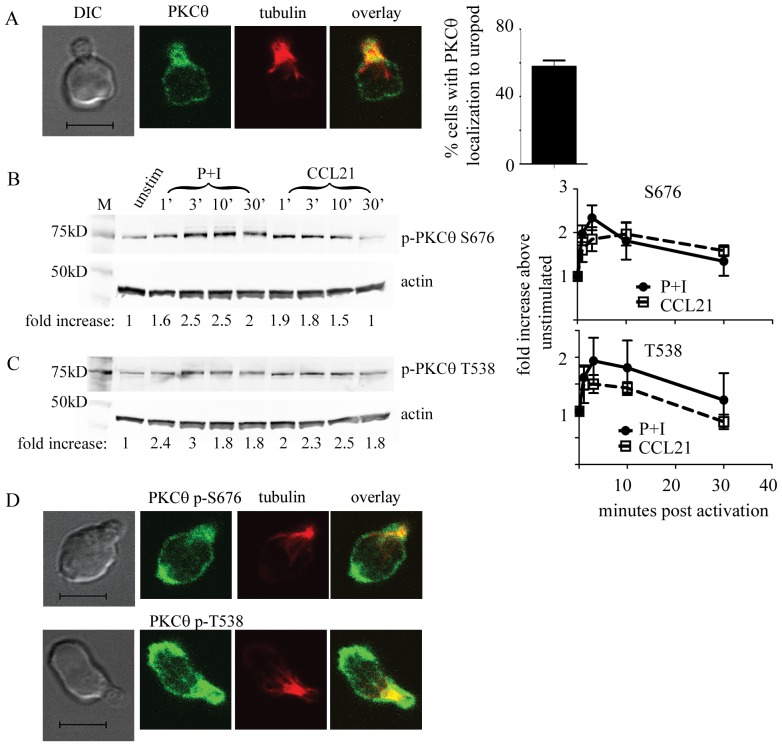
Figure 1. PKCθ is activated by CCR7 signaling and shows specific localization within migrating T cells.
(A) WT T cells from C57Bl/6 or C57Bl/6 Ly5.1 mice were activated with 300 ng/ml CCL21 for 10 minutes, adhered onto Poly-L-lysine coated coverslips, fixed, and processed for immunofluorescence. Cells were stained with anti-α tubulin antibody (in red) to mark the uropod and anti-PKCθ (green). The scale bar indicates 5 µm. Quantitation of percentage of migrating cells showing PKCθ localization to the uropod is shown on the right. 3 experiments with at least 50 cells in each experiment were quantitated and the average shown. (B and C) Purified T cells were activated with either 50 ng/ml PMA and 500 ng/ml ionomycin (P+I) or 300 ng/ml CCL21 as marked for the indicated time points. Cells were lysed and analyzed on SDS–PAGE, transferred onto PVDF membranes and blotted with anti-actin and anti-phospho-PKCθ S676 (B) or anti-phospho-PKCθ T538 (C) antibodies. Signals were quantified using the Licor Odyssey and data shown is representative of at least 3 independent experiments. Fold increase in phosphorylated PKCθ was normalized to the level in the unstimulated WT condition. (D) WT T cells were activated with 300 ng/ml CCL21, adhered onto Poly-L-lysine coated coverslips, fixed, and processed for immunofluorescence. Cells were stained with anti-tubulin antibody (in red) to mark the uropod, and also phospho-PKCθ S676 (top), or phospho-PKCθ T538 (bottom) (both in green). The scale bar indicates 5 µm.

