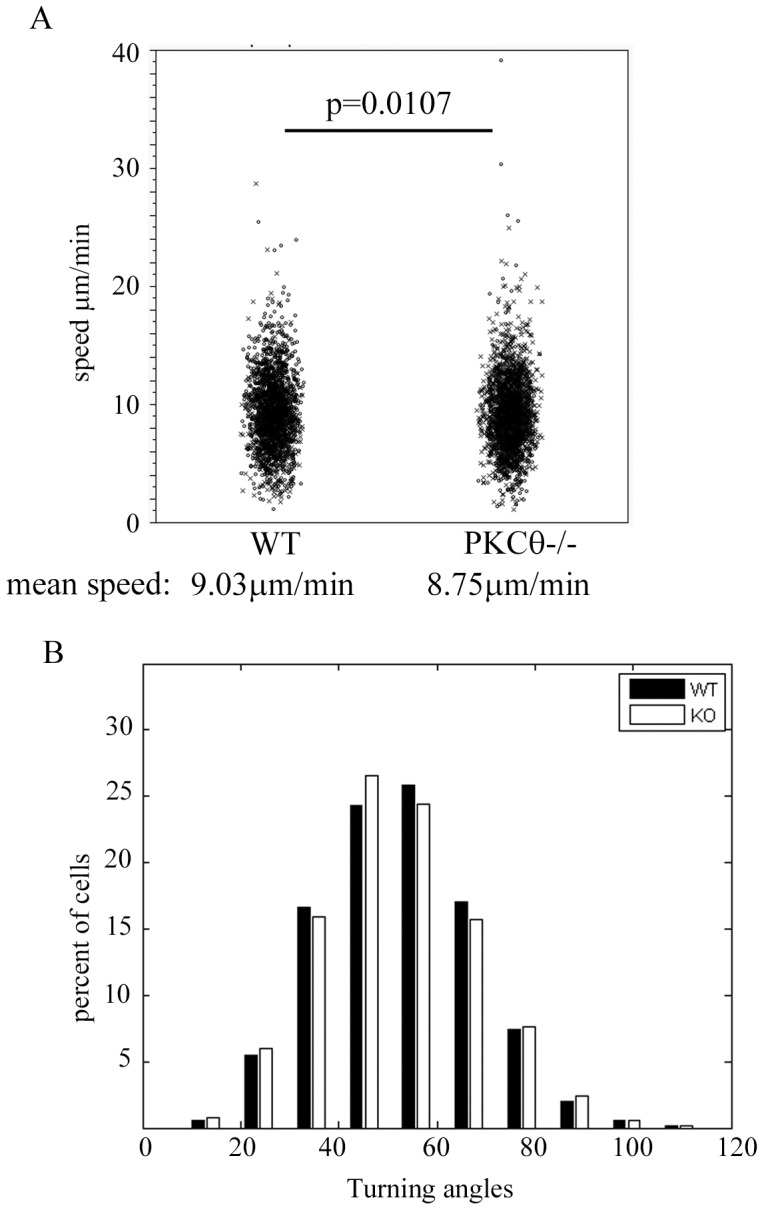
Figure 3. PKCθ plays a role in T cell motility in lymph nodes.

WT and PKCθ−/− T cells were isolated and stained with CFSE or CMTMR, injected into recipient mice, and 12–16 hours later, lymph nodes were removed and imaged as described in Materials and Methods using 2-photon microscopy. Cell motility was quantified using Imaris software and (A) speed and (B) turning angles were measured for each cell population. The individual cell mean speed in (A) and mean turning angle (B) are shown. (A) “x” indicates cells dyed with CFSE and “o” shows cells dyed with CMTMR. Statistical significance was calculated using a nested ANOVA analysis (detailed in Materials and Methods).
