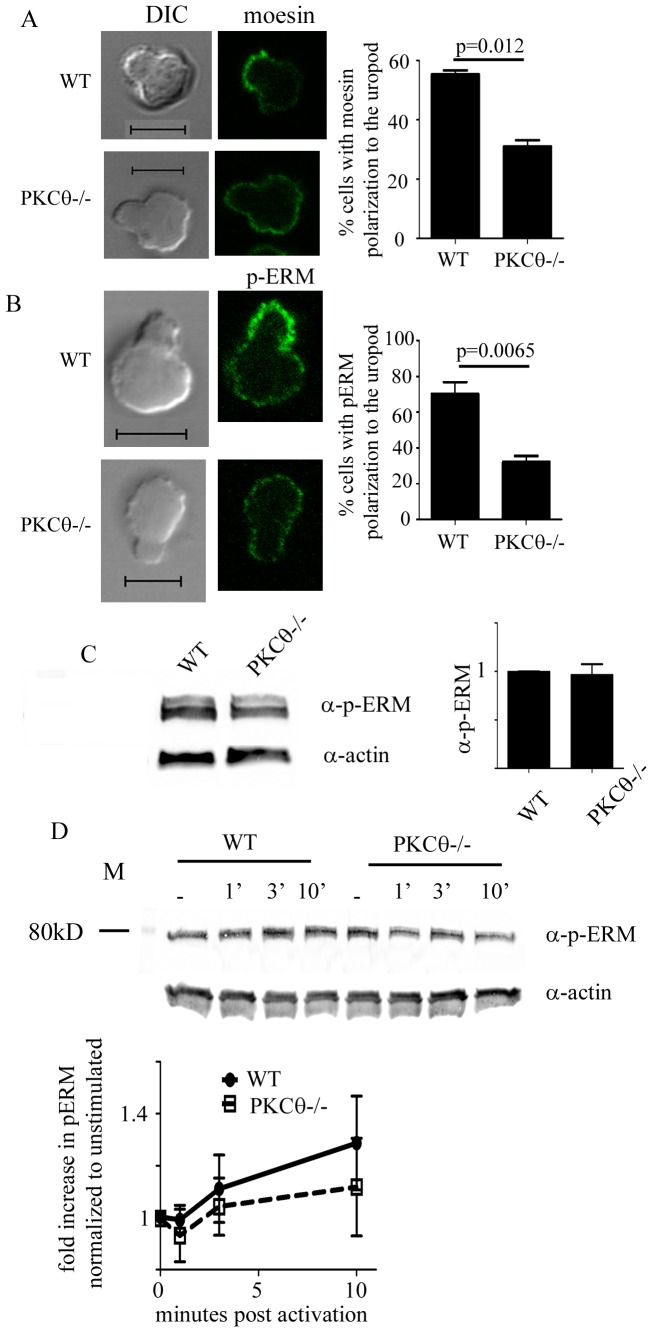
Figure 6. PKCθ is required for ERM phosphorylation and localization to the uropod.
T cells were activated with 300/ml CCL21 for 10 minutes, fixed, and processed for immunofluorescence. Cells were stained for moesin (A) or phosphorylated ERM (B). Moesin and p-ERM localization in the uropod was determined measuring intensity in at least 2 spots in and out of the uropod and assessed as “polarized” if the signal in the uropod was at least 50 units or 2-fold higher than that seen outside the uropod. For quantitation, at least 50 cells showing T cell uropod morphology were counted and the localization of MTOC, moesin, or p-ERM assessed in 3 independent experiments, totaling at least 150 cells. Error bars show SEM. Significance was determined using the unpaired student’s t-test. Scale bar indicates 5 µm. (C,D) T cells from C57Bl/6 or C57Bl/6 Ly5.1 (WT) or B6.PKCθ−/− were not activated (C) or activated with 300 ng/ml CCL21 for the indicated time points (D). Cells were lysed and analyzed on SDS–PAGE, transferred onto PVDF membranes and blotted with anti-actin and anti-phospho-ERM antibodies. Signals were quantified using the Licor Odyssey and data shown is representative of at least 3 independent experiments. (C) Fold change in phosphorylated ERM in WT and PKCθ−/− T cells was normalized to the level in the unstimulated WT condition. (D) Fold change in phosphorylated ERM upon CCL21 activation was normalized to the level in unstimulated conditions of either WT or PKCθ−/−.

