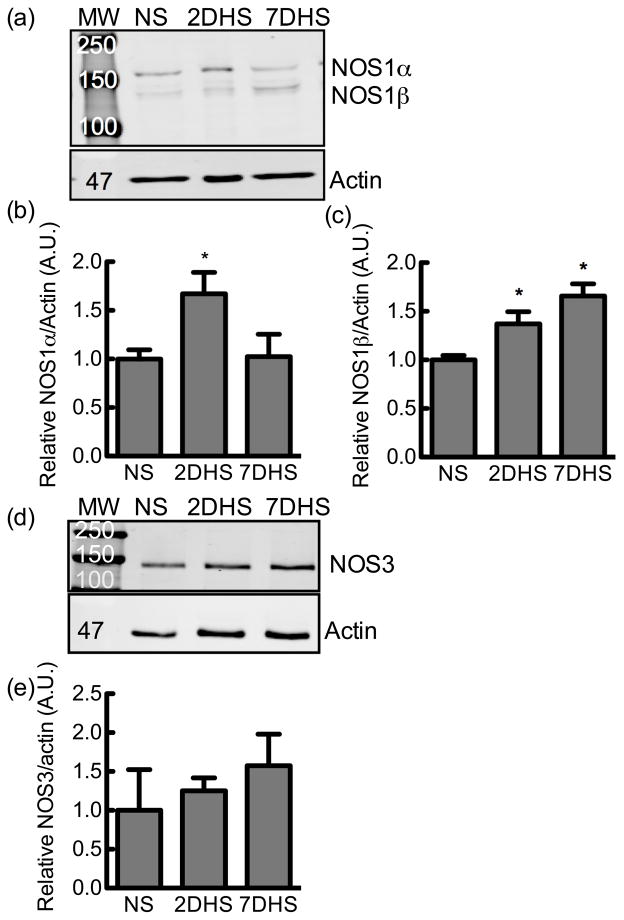
Figure 4.
Rat inner medullary collecting duct NOS1 splice variant or NOS3 expression. (a) A representative immunoblot of NOS1 splice variant expression of inner medullary homogenate from rats on a normal salt (NS), 2-day high salt (2DHS), or 7-day HS (7DHS) diet. (b) Relative densitometry of the NOS1α immunoreactive band, and (c) NOS1β immunoreactive band, N = 11–12. (d) A representative immunoblot of NOS3 expression of inner medullary collecting duct homogenate from rats on a normal salt (NS), 2-day high salt (2DHS), or 7-day HS (7DHS) diet, and relative densitometry, N = 5–7. All values are normalized to the NS sample mean. Mean ± s.e.m.

