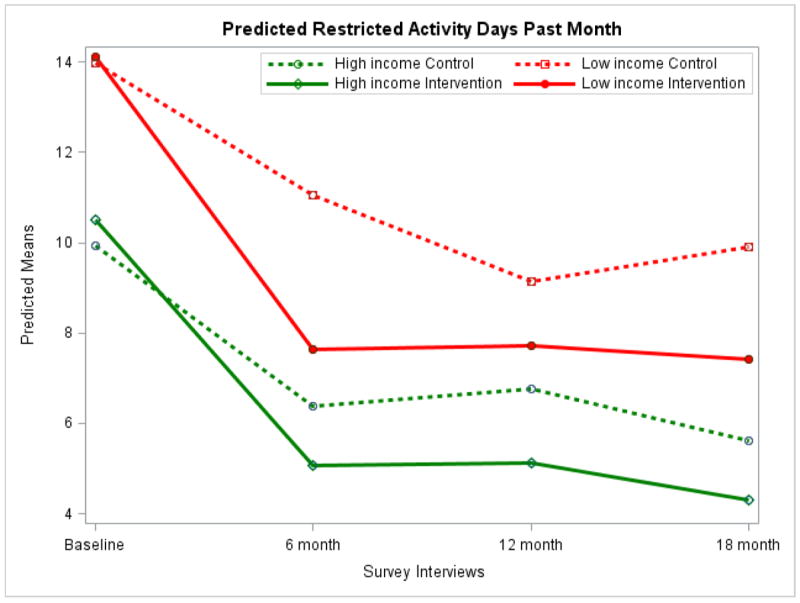
Figure 3. Predicted Restricted Activity Days Past Month.

Among low income participants there was a significant difference in CDC Healthy Days score at 6 (p = .001) and 18 (p = .022) months. Among high income participants there was a significant difference at 6 (p = .047), 12 (p = .018), and 18 (p = .045) months.
