Figure 4.

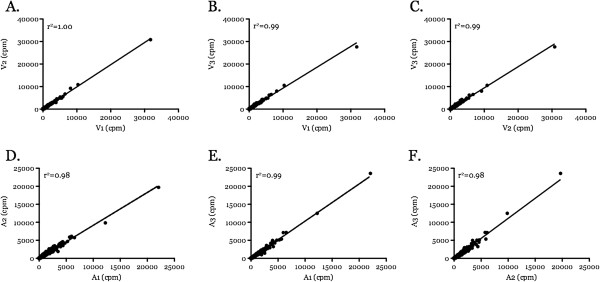
Correlation plots of signal intensities as counts per million (cpm) were compared between the three L17 biological replicate sample pairs. Comparisons of each virulent pair (A-C) and each attenuated pair (D-F) are shown.

Correlation plots of signal intensities as counts per million (cpm) were compared between the three L17 biological replicate sample pairs. Comparisons of each virulent pair (A-C) and each attenuated pair (D-F) are shown.