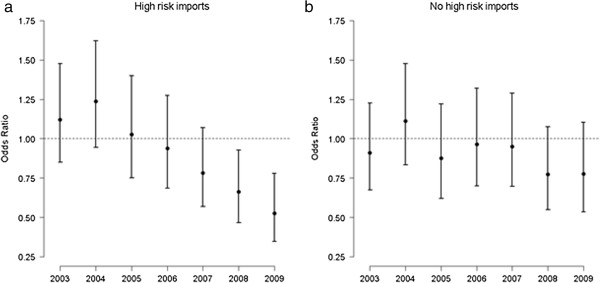
Figure 3.

Change in the odds of Scottish farms (a) with and (b) without recent high risk imports disclosing at least one tuberculin reactor through RHT from 2002 to 2009. The point estimates and vertical bars correspond to the predicted odds ratios (OR) and 95% confidence intervals (CIs) from a mixed-effects logistic regression model with the year of testing as the fixed effect and farm CPH as the random effect. The reference year is 2002.
