Fig. 1.
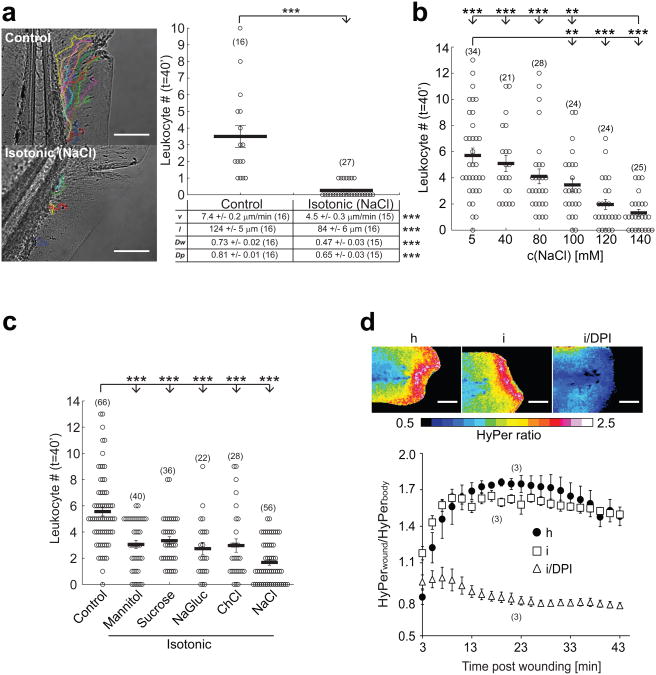
Hypotonicity is required for rapid leukocyte recruitment to larval zebrafish tail fin wounds. (a) Recruitment of leukocytes to incisional tail fin wounds imaged in zebrafish larvae by light transmission microscopy. During wounding and subsequent imaging, larvae were kept either in normal, hypotonic E3 embryo medium (‘Control’, containing 5 mM NaCl) or in embryo medium that had been adjusted to the common extracellular tonicity of vertebrates (∼270-300 mOsm) by addition of 140 mM NaCl (‘Isotonic (NaCl)’, 145 mM NaCl). Left panel, representative leukocyte tracks capturing all visible cell movements within 40 min after injury. Graph: mean number of leukocytes reaching the wound within t = 40 min after injury. Table: quantification of mean velocity (v), pathlength (l), wound directionality (Dw), and path persistence (Dp). (b) Mean leukocyte recruitment to larval tail fin wounds within 40 min after injury plotted vs. salt concentration of the medium. (c) Mean leukocyte recruitment within 40 min after injury as a function of different isotonic medium compositions. ‘Control’, 5 mM NaCl. ‘Mannitol’, control + 270 mM Mannitol. ‘Sucrose’, control + 270 mM Sucrose. ‘NaGluc’, control + 135 mM sodium gluconate. ‘ChCl’, control + 135 mM choline chloride. ‘NaCl’, control + 135 mM NaCl. (d) HyPer imaging of wound margin H2O2 production in response to wounding in hypotonic (h), isotonic (i), or isotonic medium + 100 μM of the NADPH oxidase inhibitor diphenyl iodonium chloride (i/DPI). Upper panel, representative HyPer-ratio images. Red, high [H2O2]. Blue, low [H2O2]. Lower panel, normalized HyPer-ratio as a function of time after wounding. Number of larvae (n) used for the analyses is given in parentheses on the graphs. Error bars, SEM. **, t-test p< 0.005. ***, t-test p<0.0005. Scale bar, 100 μm.

