Fig. 2.
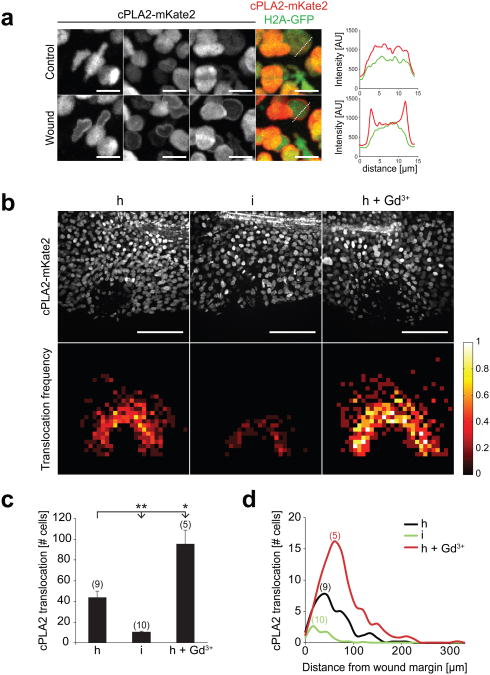
Hypotonicity locally activates cPLA2 at the wound site. (a) Confocal imaging of injury induced cPLA2-mKate2 translocation to nuclear membranes in live zebrafish larvae. Left panel, representative of maximal intensity projections showing cPLA2-mKate2 localization before (upper image panel) or 30 sec after (lower image panel) laser injury of the tail fin. N.b. the cell cytoplasm and cell periphery are not visible, since cPLA2 localizes exclusively to the nucleus. These magnifications were derived from tissue regions near the (prospective) injury site. Outmost right image column, superposition of nuclear H2A-GFP (green) cPLA2-mKate2 (red) fluorescence. Right panel: representative intensity profile plots of H2A-GFP (green) and cPLA2-mKate2 (red) derived from neighbouring image data (dashed lines). Scale bar, 10 μm. (b) Upper panel: full field of view images of cPLA2-mKate2 fluorescence in live tail fins subjected to hypotonic (h), isotonic (i), or hypotonic laser injury in the presence of 500 μM Gd3+ (h+Gd3+) 30 sec post wounding. Lower panel: average cPLA2-mKate2 translocation density projected onto normalized wound coordinates at indicated conditions (see Methods section for details). Colour-scale, relative translocation densities (white=high, red=low, black=none). Scale bar: 100 μm. (c) Average number of nuclei per animal that show cPLA2-mKate2 translocation in response to wounding at indicated conditions. Number of larvae (n) used for the analyses is given in parentheses on the graphs. Error bars: SEM. *: t-test p< 0.05. **: t-test p< 0.005. (d) Average number of nuclei per animal with cPLA2-mKate2 translocation in response to wounding at indicated conditions shown as a function of distance from the wound margin.

